U.S. obesity rates hit historic highs in 2018 – Nine states reach adult obesity rates of 35 percent or more – “These latest data shout that our national obesity crisis is getting worse”
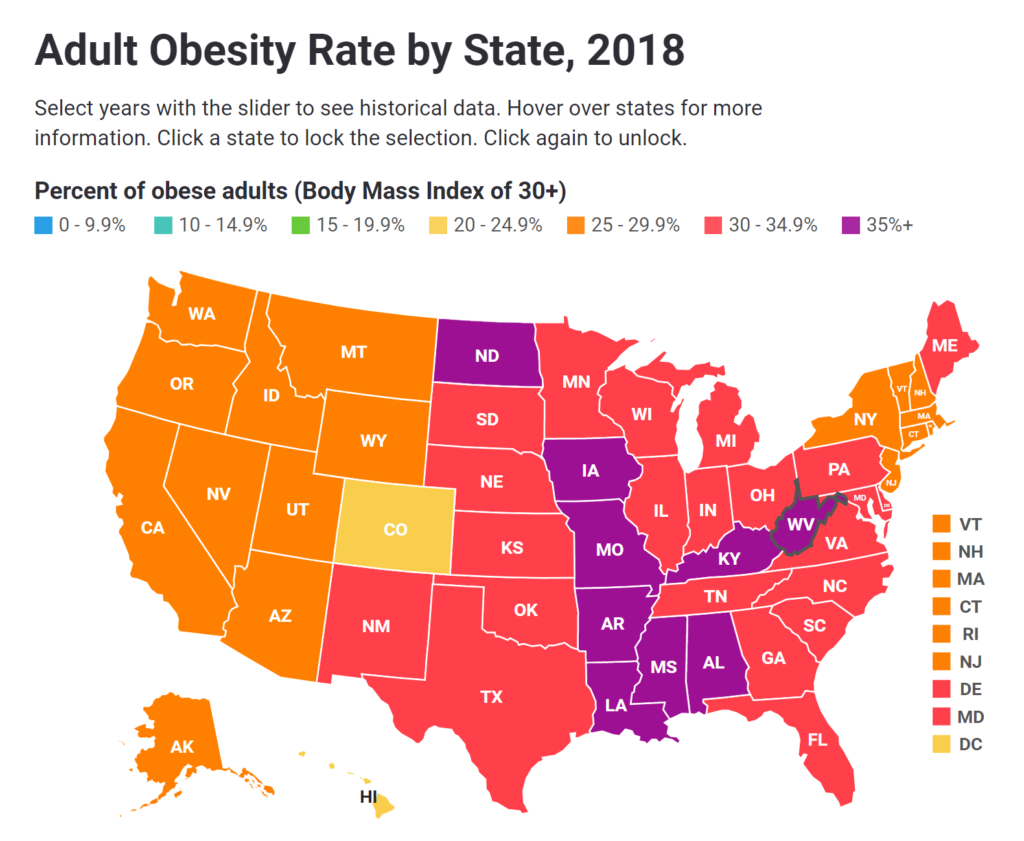
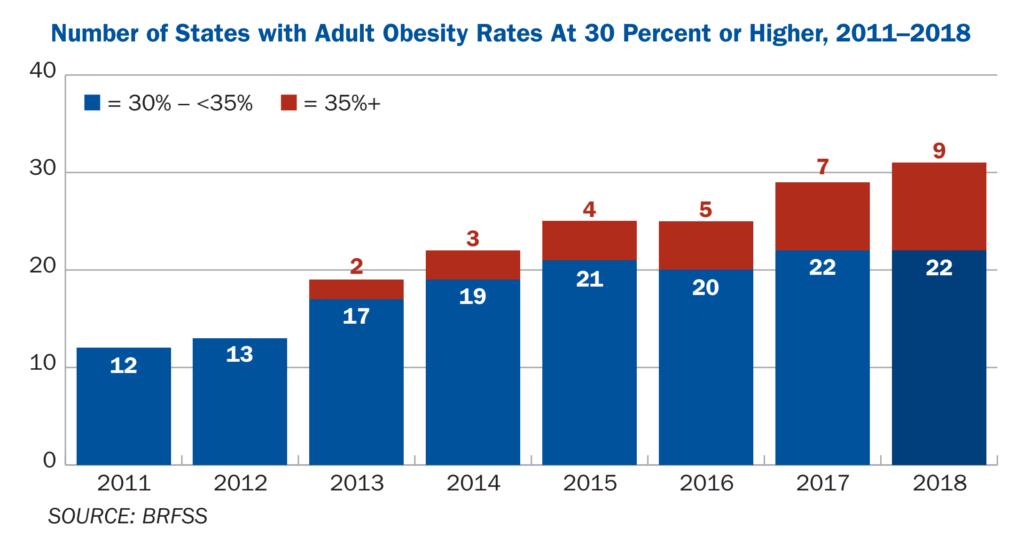
WASHINGTON, DC, 12 September 2019 (Trust for America’s Health) – Nine U.S. states had adult obesity rates above 35 percent in 2018, up from seven states at that level in 2017, an historic level of obesity in the U.S., according to the 16th annual State of Obesity: Better Policies for a Healthier America report [pdf] released today by the Trust for America’s Health (TFAH).
The report based in part on newly released data from the Centers for Disease Control and Prevention’s Behavioral Risk Factor Surveillance System (BRFSS), and analysis by TFAH, provides an annual snapshot of obesity rates nationwide. The State of Obesity series and this report were made possible by funding from the Robert Wood Johnson Foundation.
Obesity has serious health consequences including increased risk for type 2 diabetes, high blood pressure, stroke and many types of cancers. Obesity is estimated to increase national healthcare spending by $149 billion annually (about half of which is paid for by Medicare and Medicaid) and being overweight or obese is the most common reason young adults are ineligible for military service.
Obesity rates vary considerably between states with Mississippi and West Virginia having the highest level of adult obesity in the nation at 39.5 percent and Colorado having the lowest rate at 23.0 percent.
For the first time, adult obesity rates were above 35 percent in nine states in 2018: Alabama, Arkansas, Iowa, Kentucky, Louisiana, Mississippi, Missouri, North Dakota and West Virginia.
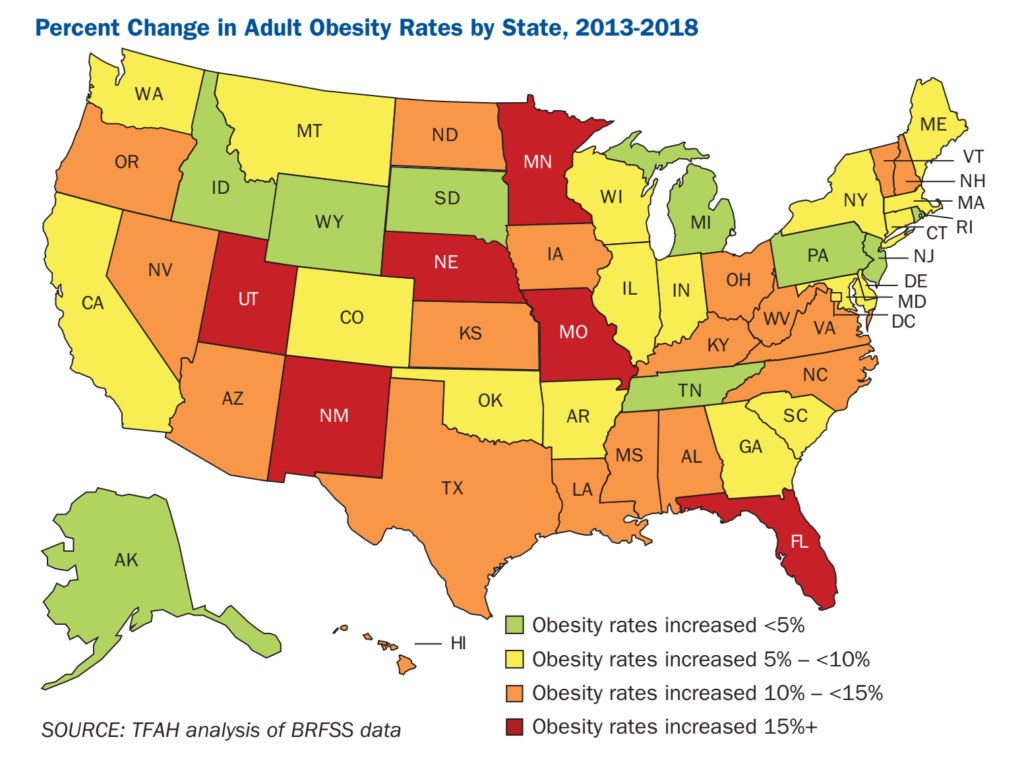
As recently as 2012, no state had an adult obesity rate over 35 percent and within the last five years (2013 and 2018) 33 states had statistically significant increases in their rates of adult obesity.
“These latest data shout that our national obesity crisis is getting worse,” said John Auerbach, President and CEO of Trust for America’s Health. “They tell us that almost 50 years into the upward curve of obesity rates we haven’t yet found the right mix of programs to stop the epidemic. Isolated programs and calls for life-style changes aren’t enough. Instead, our report highlights the fundamental changes that are needed in the social and economic conditions that make it challenging for people to eat healthy foods and get sufficient exercise.”
Differential impact among minority populations
The report highlights that obesity levels are closely tied to social and economic conditions and that individuals with lower incomes are more at risk. People of color, who are more likely to live in neighborhoods with few options for healthy foods and physical activity, and, are the target of widespread marketing of unhealthy foods, are at elevated risk.
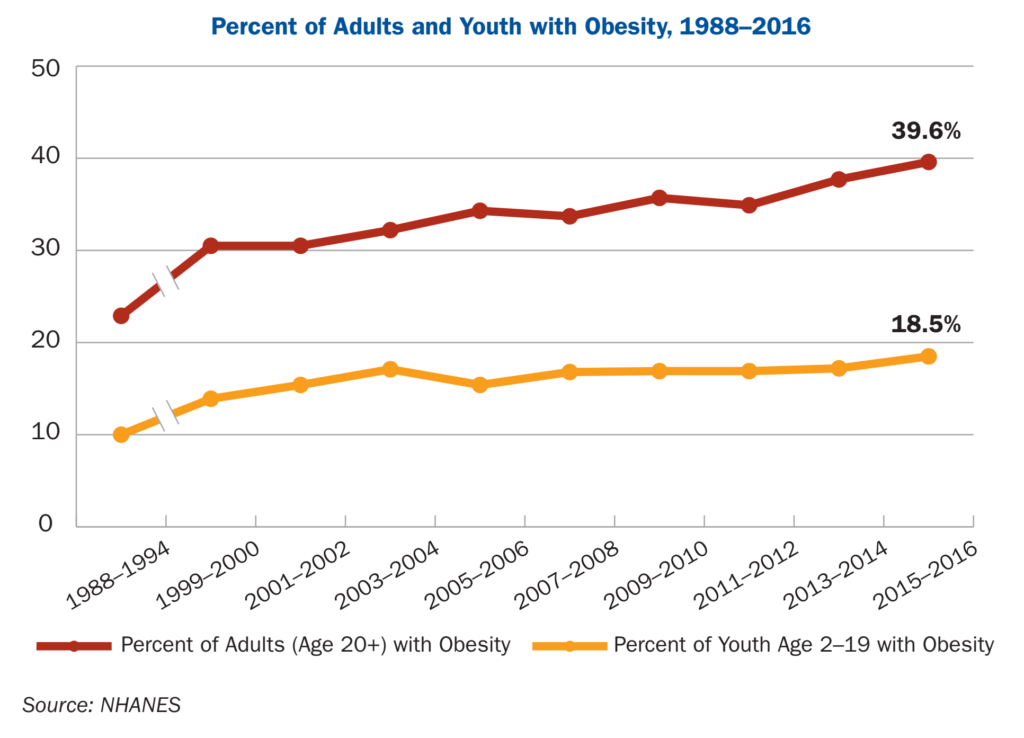
As of 2015-2016, the latest available data, nearly half of Latino (47 percent) and Black adults (46.8) had obesity while adult obesity rates among White and Asian adults were 37.9 percent and 12.7 percent respectively. Incidence of childhood obesity was highest amongst Latino children at 25.8 percent while 22 percent of Black children had obesity, 14 percent of White children had obesity and 11 percent of Asian children had obesity.
What could work?
While the obesity rates are alarming, there are new data offering the promise of policies that combat the epidemic, namely promoting healthier food for children through revamped WIC food packages and fostering behavior change through taxes on sugary drinks.
- Obesity rates for children enrolled in WIC (Special Supplemental Nutrition Program for Women, Infants and Children) continue to decline, from 15.9 percent in 2010 to 13.9 percent in 2016. In 2009, the USDA updated WIC food packages to more closely meet recommended national dietary guidelines including the addition of more fruits, vegetables and whole grains and reduced fat levels in milk and infant formula. A Los Angeles County study published this year found that 4-year-olds who had received the revised WIC food package since birth had reduced risk for obesity.
- A number of U.S. cities and the Navajo Nation have passed local taxes on sugary drinks that are showing promise as a means to change consumers’ beverage habits. Studies of a 1-cent per ounce tax in Berkeley, California and a 1.5 cent per ounce tax in Philadelphia, Pennsylvania found that the consumption of sugary drinks decreased significantly after the tax was imposed.
“Policies such as these are proving effective in changing behavior. But, no single solution – however promising – is sufficient. Obesity is a complex problem and will need multi-sector, multi-factor solutions,” said TFAH’s Auerbach.
“Creating the conditions that allow people to more easily make healthy choices is central to preventing obesity, as is prioritizing investment in those communities most affected by the crisis,” Auerbach said.
Recommendations for policy action
The report includes 31 recommendations for policy action by federal, state and local government, across several sectors, designed to improve access to nutritious foods and provide safe opportunities for physical activity, while minimizing harmful marketing and advertising tactics.
Among the report’s recommendations for policies to address the obesity crisis are:
- Expand the Special Supplemental Nutrition Program for Women, Infants and Children (WIC) to age 6 for children and for two years postpartum for mothers and fully fund the WIC breastfeeding Peer Counseling Program.
- Increase the price of sugary drinks through excise taxes and use the revenue to address health and socioeconomic disparities.
- Ensure that CDC has enough funding to grant every state appropriate funding to implement evidence-based obesity prevention strategies (currently, CDC only has enough funding to work with 16 states).
- Make it more difficult to market unhealthy food to children by ending federal tax loopholes and business costs deductions related to the advertising of such foods to young audiences.
- Fully fund the Student Support and Academic Enrichment program and other federal programs that support student physical education.
- Encourage safe physical activity by funding Safe Routes to Schools (SRTS), Complete Streets, Vision Zero and other pedestrian safety initiatives through federal transportation and infrastructure funding.
- Ensure that anti-hunger and nutrition-assistance programs, like the Supplemental Nutrition Assistance Program (SNAP), WIC, and others follow the Dietary Guidelines for Americans and make access to nutritious food a core program tenet.
- Strengthen and expand school nutrition programs beyond federal standards to include universal meals, flexible breakfasts and eliminate all unhealthy food marketing to students.
- Enforce existing laws that direct most health insurers to cover obesity-related preventive services at no-cost sharing to patients.
- Cover evidence-based comprehensive pediatric weight management programs and services in Medicaid.
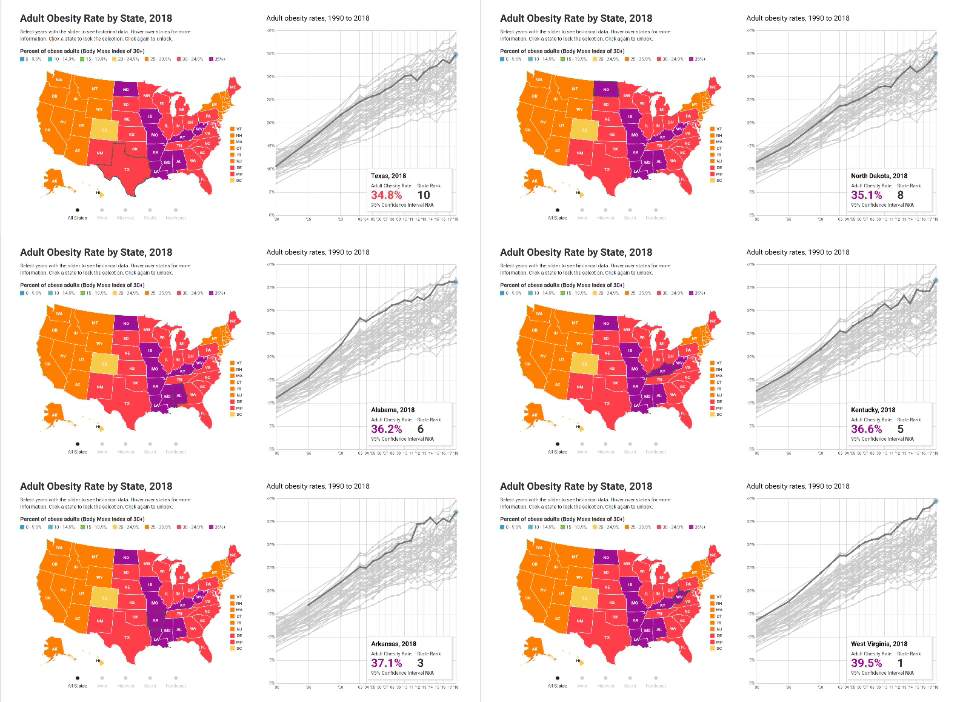
State by State rates of adult obesity – highest to lowest
Tie: Mississippi and West Virginia (39.5%), 3. Arkansas (37.1%), 4. Louisiana (36.8%), 5. Kentucky (36.6%), 6. Alabama (36.2%), 7. Iowa (35.3%), 8. North Dakota (35.1%), 9. Missouri, (35.0%), 10. – Tie: Oklahoma and Texas (34.8%), 12. – Tie: Kansas and Tennessee (34.4%), 14. South Carolina (34.3 %), 15. – Tie: Indiana and Nebraska (34.1%), 17. Ohio (34.0%), 18. Delaware (33.5%), 19 – Tie: Michigan, North Carolina (33.0), 21. Georgia (32.5%), 22. New Mexico (32.3%), 23. Wisconsin (32.0%), 24. Illinois (31.8%), 25. – Tie: Maryland and Pennsylvania (30.9%), 27. Florida (30.7%), 28 – Tie: Maine and Virginia (30.4%), 30. Tie: Minnesota and South Dakota (30.1%), 32. Oregon (29.9 %), 33. New Hampshire (29.6%), 34. Three-way Tie: Alaska, Arizona and Nevada (29.5%), 37. Wyoming (29.0%), 38. Washington (28.7%), 39. Idaho (28.4%), 40. Utah (27.8%), 41. Rhode Island (27.7%), 42. New York (27.6%), 43. Vermont (27.5%), 44. Connecticut (27.4%), 45. Montana (26.9%), 46. California (25.8%), 47. – Tie: Massachusetts and New Jersey (25.7%), 49. Hawaii (24.9%), 50. District of Columbia (24.7%), 51. Colorado (23.0%).
Contact
- Rhea Faberman, 202-864-5941, RFaberman@tfah.org
- Rebekah Pepper, 202-544-4705, Pepper@teamsubjectmatter.com
U.S. Obesity Rates at Historic Highs – Nine States Reach Adult Obesity Rates of 35 Percent or More
