Real U.S. debt levels could be a shocking 2,000 percent of GDP – “We are quickly approaching a situation where we have dug ourselves a debt hole which is going to have profoundly negative effects on the economy for probably decades”
By Jeff Cox
9 September 2019
(CNBC) – Total potential debt for the U.S. by one all-encompassing measure is running close to 2,000% of GDP, according to an analysis that suggests danger but also cautions against reading too much into the level.
AB Bernstein came up with the calculation — 1,832 percent, to be exact — by including not only traditional levels of public debt like bonds but also including financial debt and all its complexities as well as future obligations for so-called entitlement programs like Social Security, Medicare and public pensions.
Putting all that together paints a daunting picture but one that requires nuance to understand. Paramount is realizing that not all of the debt obligations are set in stone, and it’s important to know where the leeway is, particularly in the government programs that can be changed either by legislation or accounting.
“This conceptual difference is important to acknowledge because this lens is often used by those who wish to paint a dire picture about debt,” Philipp Carlsson-Szlezak, chief U.S. economist at AB Bernstein, said in the report. “While the picture is dire, such numbers don’t prove we are doomed or that a debt crisis is inevitable.”
Globally, we have become over-reliant on borrowing as a solution for everything. Political excuses abound for why it doesn’t matter, which just clearly isn’t the case.
Maya MacGuineas, president of the Committee for a Responsible Federal Budget
Crisis measures cut both ways — sometimes a seemingly smaller level of debt can cause outsized problems during times of economic stress, such as during the financial crisis. And larger levels of debt can be sustained so long as other conditions, like leverage levels, or debt to capital, are manageable.
The key is not always gross dollar amount but rather ability to pay.
“U.S. debt is large. And it’s growing. But if we want to think about debt problems (in any sector – sovereign, households, firms or financials) the conditions rather than the levels are more significant,” Carlsson-Szlezak said. “Debt problems could, arguably would have, already happened at lower levels of debt if the macro conditions forced it.”
“Profoundly negative effects”
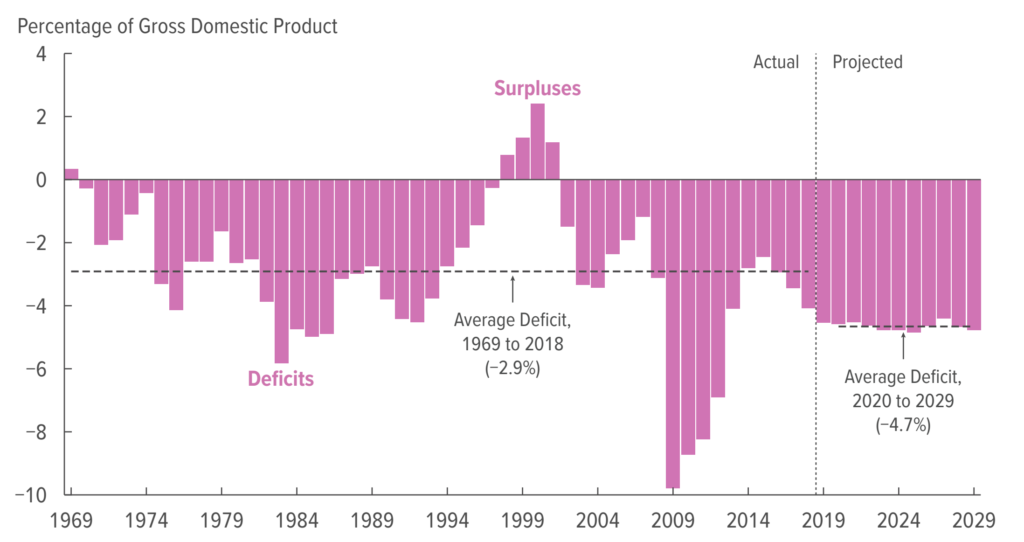
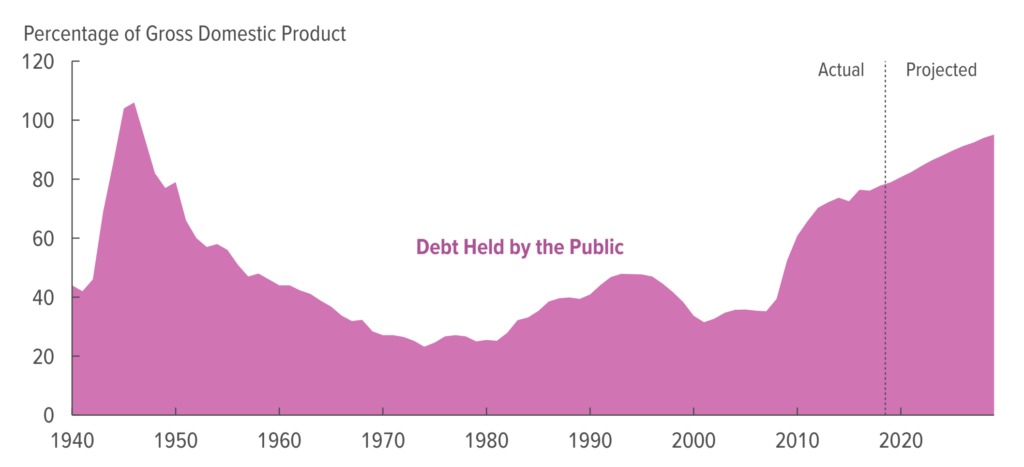
The warnings about potential debt hazards come as the total federal debt outstanding has surged to $22.5 trillion, or about 106% of GDP. Excluding intragovernmental obligations, debt held by the public is $16.7 trillion, or 78% of GDP.
That latter total, considered to be more relevant as an economic burden, is likely to rise to 105% by 2028, according to Congressional Budget Office projections. However, the CBO notes that the numbers are subject to revision depending on how government policies play out.
Advocates for fiscal reform argue that the debt impact has indeed reached the point where action is necessary.
“Globally, we have become over-reliant on borrowing as a solution for everything. Political excuses abound for why it doesn’t matter, which just clearly isn’t the case,” said Maya MacGuineas, president of the Committee for a Responsible Federal Budget, a bipartisan committee of legislators, business leaders and economists that counts former Federal Reserve chairs Paul Volcker and Janet Yellen among its members.
“We are quickly approaching a situation where we have dug ourselves a debt hole which is going to have profoundly negative effects on the economy for probably decades going forward,” MacGuineas added. [more]
Real US debt levels could be a shocking 2,000% of GDP, a Wall Street report suggests