How contemporary bioclimatic and human controls change global fire regimes
By Douglas I. Kelley, Ioannis Bistinas, Rhys Whitley, Chantelle Burton, Toby R. Marthews, and Ning Dong
19 August 2019
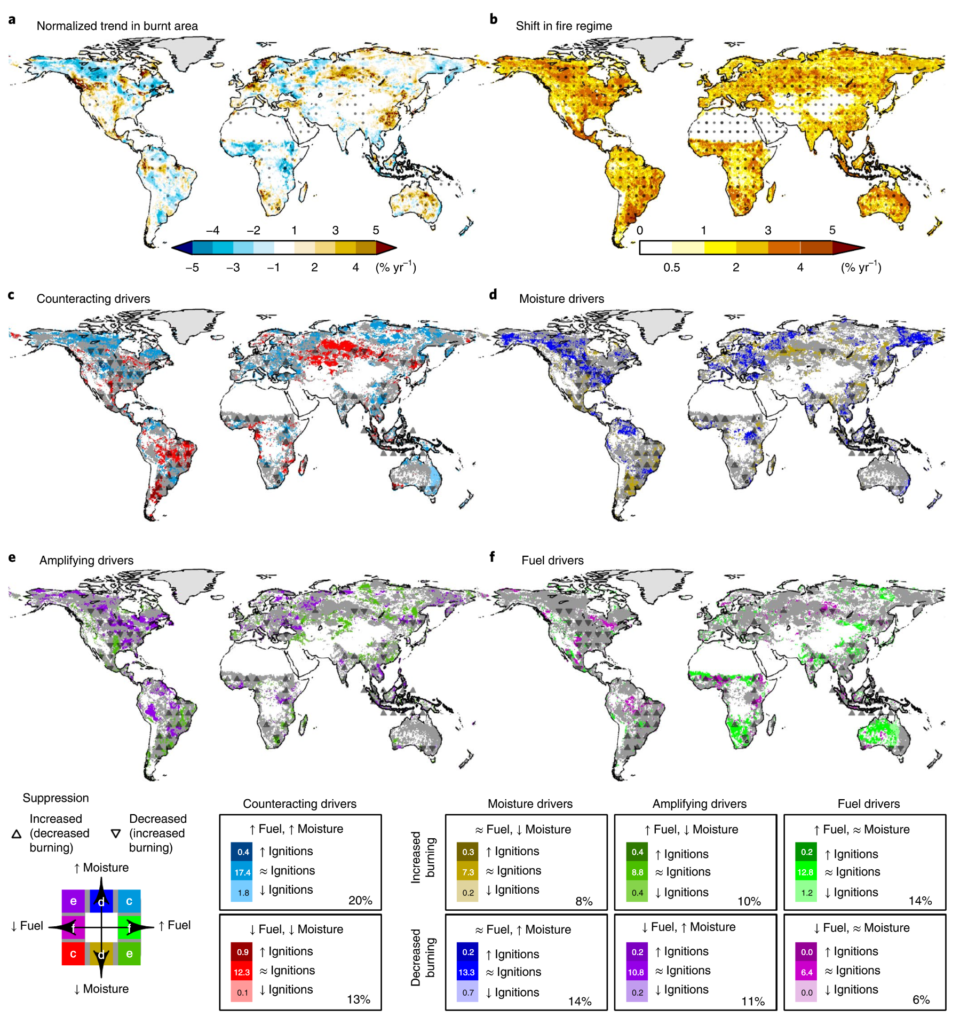
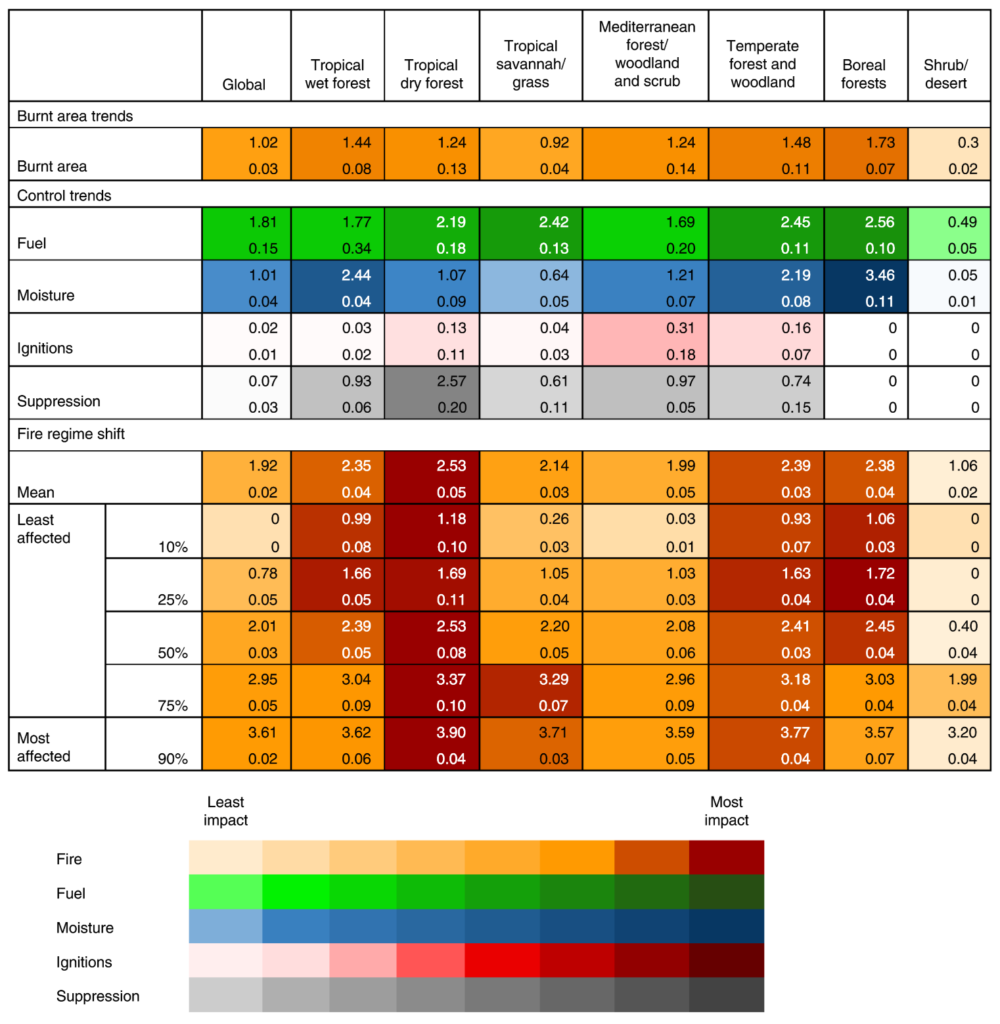
(Nature Climate Change) – Anthropogenically driven declines in tropical savannah burnt area1,2 have recently received attention due to their effect on trends in global burnt area3,4. Large-scale trends in ecosystems where vegetation has adapted to infrequent fire, especially in cooler and wetter forested areas, are less well understood. Here, small changes in fire regimes can have a substantial impact on local biogeochemistry5. To investigate trends in fire across a wide range of ecosystems, we used Bayesian inference6 to quantify four primary controls on burnt area: fuel continuity, fuel moisture, ignitions and anthropogenic suppression. We found that fuel continuity and moisture are the dominant limiting factors of burnt area globally. Suppression is most important in cropland areas, whereas savannahs and boreal forests are most sensitive to ignitions. We quantify fire regime shifts in areas with more than one, and often counteracting, trends in these controls. Forests are of particular concern, where we show average shifts in controls of 2.3–2.6% of their potential maximum per year, mainly driven by trends in fuel continuity and moisture. This study gives added importance to understanding long-term future changes in the controls on fire and the effect of fire trends on ecosystem function.
Fire-prone tropical ecosystems account for 78% of global burnt area, despite covering just 16% of the land surface. Consequently, changes in these fire regimes have a disproportionate effect on trends in global burnt area. Contribution from less fire-prone ecosystems to the global signal is less certain. Given the importance of multiple bioclimatic controls in limiting fire, it is difficult to distinguish any dominant driver. To determine what drivers act in these areas requires an assessment of the interplay of different controls on burnt area, which may also highlight potential shifts in fire regimes not detectable via trend analysis of burnt area alone.
Fire danger indices can be used to quantify the influence of trends in climate on fire weather, providing policy-relevant information for fire management. However, they often exclude the effects of fuel dynamics, ignitions and human activity. It can be hard to relate indices to observable fire variables useful in global analyses. Fire-enabled terrestrial biosphere models can account for these drivers. However, most terrestrial biosphere models fail to reproduce trends in fire reliably. The models even disagree on basic spatial patterns and magnitudes of burnt area due to miss-ing descriptions of key anthropogenic processes suppressing fire and an imbalance in the relative strength of bioclimatic controls. […]
We show that suppression of burnt area by cropland is much greater than the cropland’s own extent, suggesting that landscape fragmentation is an additional mechanism of greater importance than the homogenous cropland representation in most vegetation-fire models. Another important result is that suppression from population density is dramatic, drawing attention to the lack of representation of this effect in standard models.
Many recent global fire model developments have focused on the correct representation of fuel and moisture controls, arguing that ignitions are less important when reproducing global burnt area. Our results partially support this hypothesis—areas of ignition limitation tend to occur in areas of even more severe fuel limitation and have a much smaller ‘potential’ limitation than other controls. However, we also show that many savannahs and boreal forest areas are sensitive to small changes in ignitions, where levels of burning are important vegetative controls. The correct representation of ignitions is therefore still crucial for simulating and assessing changing fire regimes under changing climate, land-use and population growth, and projected increases in lightning. [more]
How contemporary bioclimatic and human controls change global fire regimes