Decades-long butterfly study shows 33 percent population loss – “These declines in abundance are happening in common species”
By Steve Lundeberg
2 July 2019
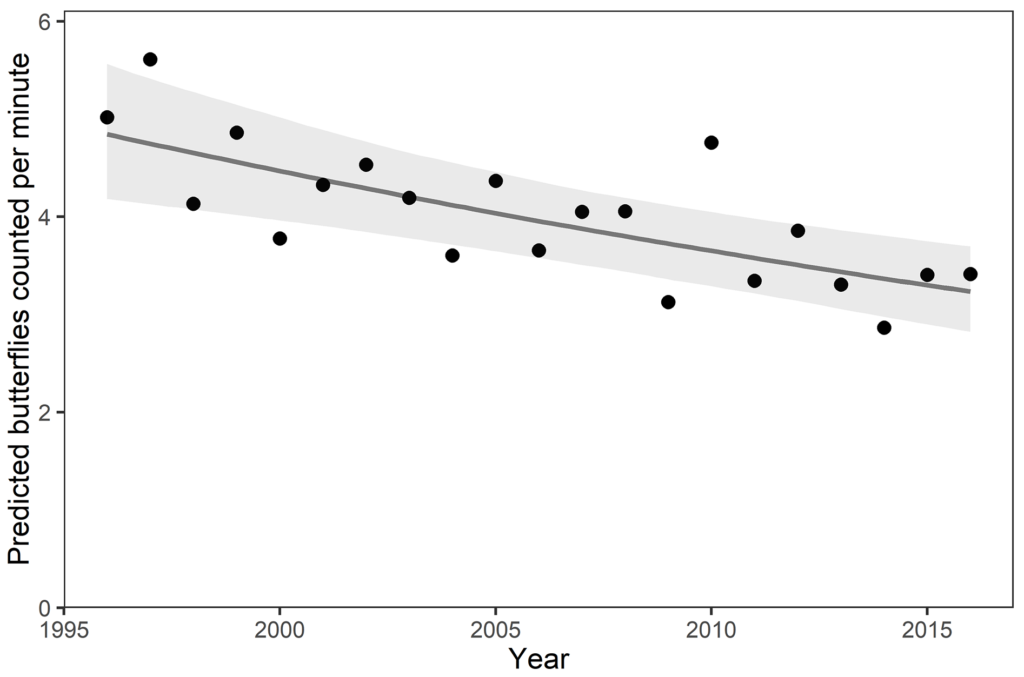
CORVALLIS, Oregon (Oregon State University) – The most extensive and systematic insect monitoring program ever undertaken in North America shows that butterfly abundance in Ohio declined yearly by 2%, resulting in an overall 33% drop for the 21 years of the program.
Though the study was limited to one group of the insect class and one geographic area, the findings provide an important baseline for what’s happening more broadly with insect populations amid climate change and other human-caused disturbances, the study’s corresponding author said. The findings also are in line with those of butterfly monitoring programs in multiple European countries.
“These declines in abundance are happening in common species,” said Oregon State University researcher Tyson Wepprich, who led the study. “Declines in common species concern me because it shows that there are widespread environmental causes for the declines affecting species we thought were well adapted to share a landscape with humans. Common species are also the ones that contribute the bulk of the pollination or bird food to the ecosystem, so their slow, consistent decline is likely having ripple effects beyond butterfly numbers.”
Findings were published today in PLOS ONE.
Wepprich, a postdoctoral scholar in botany and plant pathology in OSU’s College of Agricultural Sciences, used more than 24,000 butterfly surveys contributed by trained citizen scientists from 1996 through 2016 to establish his findings.
“Because it’s easier to monitor butterflies than other insects – lots of people like butterflies and enjoy keeping track of them – butterflies tend to be the best source of abundance data for tracking insect population declines and increases,” Wepprich said. “Environmental assessments use them as an indicator for the general trajectory of biodiversity since they experience the same types of pressures from land-use changes, climate change and habitat degradation as other insect groups.”
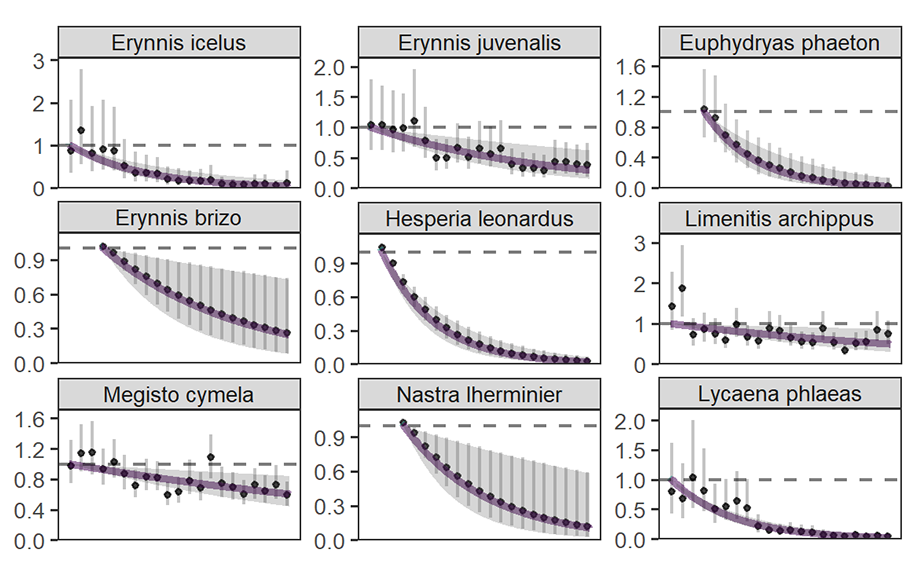
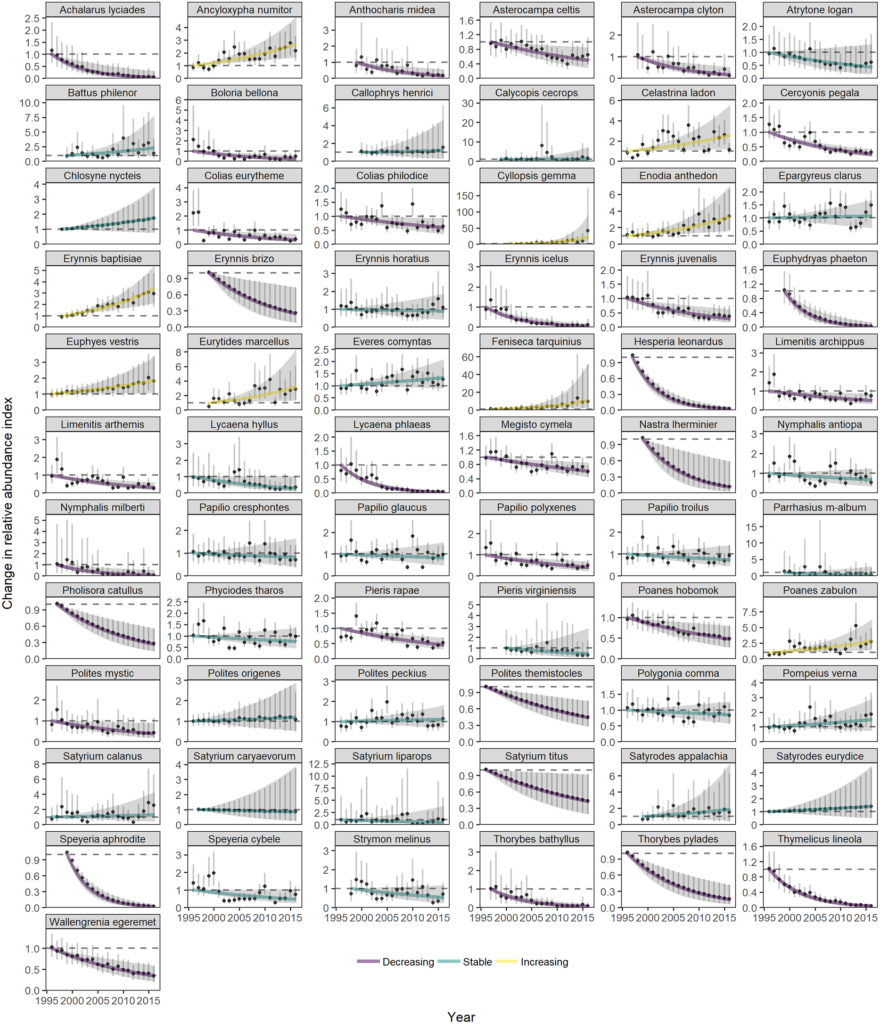
The data from Ohio enabled population trends to be estimated for 81 butterfly species and found three times as many species were trending downward as upward – three out of every four species with a positive or negative trend grew less abundant over the course of the monitoring. Forty of the analyzed species had no significant trend up or down.
“Species with more northern distributions and fewer annual generations declined the most rapidly,” he said, adding that these species are adapted to cooler regions and may do worse in Ohio with warming temperatures.
Wepprich noted that even some invasive species associated with human-dominated landscapes are declining, which suggests the trends are rooted in widespread environmental causes.
“Analyses of insect declines are dominated by European studies about butterflies, but our study is showing that the rate of change in Ohio butterfly abundance is very similar to that found in monitoring programs in the UK, the Netherlands and Spain,” Wepprich said. “The rate of total decline and the proportion of species in decline mirror those documented in comparable monitoring programs. What’s common among all of the monitoring programs is that they are in areas with a high human impact and made possible by dedicated volunteer recorders.”
Even though the common butterfly species aren’t yet close to extinction, declines in those species will nevertheless have an outsized, negative impact on ecosystem services provided by insects, he said.
Earlier studies involving intensive, long-term monitoring of individual butterfly species have allowed for rigorous estimates of declines in those species, Wepprich said. Over the past two decades, the migratory eastern North American monarch has declined by more than 85% and the western North American monarch by more than 95%, said Wepprich, adding that some of the rarest butterflies have also fallen off sharply.
“Monarchs and rare species were monitored because people are worried about them going extinct,” Wepprich said. “In Ohio, they monitored every species they could and found declines in species previously not on the radar for conservation.”
The rate of butterfly decline in Ohio is greater than the global rate of 35% over 40 years, Wepprich said, and is closer to the estimated rate for insects in general: a 45% decline over 40 years.
“Our study adds another example of declines in common butterfly species thought to be well suited to human-modified habitat,” he said.
The Ohio Lepidopterists, the Ohio Department of Natural Resources, the Ohio Biological Survey, the Cleveland Museum of Natural History and the Dawes Arboretum sponsor the long-term monitoring program. Supporting this research were the U.S. Department of the Interior and North Carolina State University.
Collaborators included scientists from Michigan State University, Georgetown University, the University of Oregon and the Ohio Lepidopterists.
Decades-long butterfly study shows common species on the decline
Butterfly abundance declines over 20 years of systematic monitoring in Ohio, USA
ABSTRACT: Severe insect declines make headlines, but they are rarely based on systematic monitoring outside of Europe. We estimate the rate of change in total butterfly abundance and the population trends for 81 species using 21 years of systematic monitoring in Ohio, USA. Total abundance is declining at 2% per year, resulting in a cumulative 33% reduction in butterfly abundance. Three times as many species have negative population trends compared to positive trends. The rate of total decline and the proportion of species in decline mirror those documented in three comparable long-term European monitoring programs. Multiple environmental changes such as climate change, habitat degradation, and agricultural practices may contribute to these declines in Ohio and shift the makeup of the butterfly community by benefiting some species over others. Our analysis of life-history traits associated with population trends shows an impact of climate change, as species with northern distributions and fewer annual generations declined more rapidly. However, even common and invasive species associated with human-dominated landscapes are declining, suggesting widespread environmental causes for these trends. Declines in common species, although they may not be close to extinction, will have an outsized impact on the ecosystem services provided by insects. These results from the most extensive, systematic insect monitoring program in North America demonstrate an ongoing defaunation in butterflies that on an annual scale might be imperceptible, but cumulatively has reduced butterfly numbers by a third over 20 years.
Butterfly abundance declines over 20 years of systematic monitoring in Ohio, USA

