Wettest 12 months in U.S. history, again – “The last twelve months beat the previous record, set just a month ago, by a full 1.48 inches”
By Bob Henson
6 June 2019
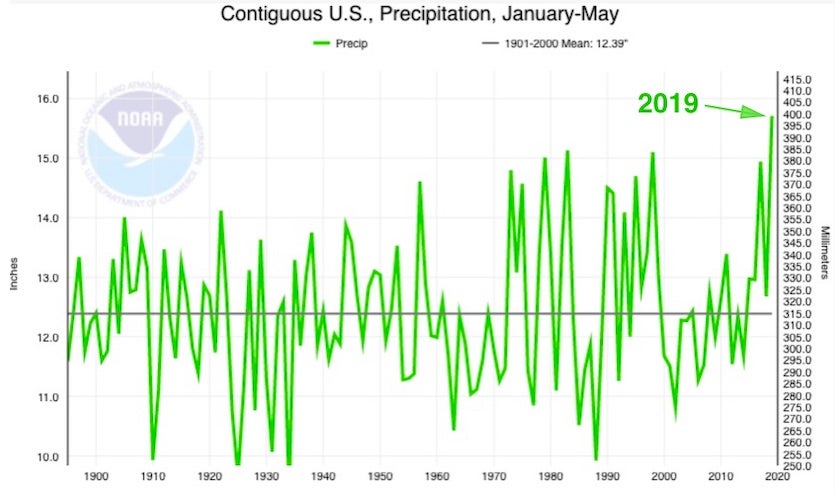
(Weather Underground) – Propelled by a two-week siege of widespread severe weather and heavy rain in late May, the contiguous U.S. has once again broken its record for the wettest year-long span in data going back to 1895. According to the monthly U.S. climate summary released Thursday from the NOAA National Centers for Environmental Information, last month was the second-wettest month in U.S. history, with the nationally averaged total of 4.41” just behind the 4.44” recorded in May 2015. All other months in U.S. precipitation annals have been no wetter than 4.24”.
The year to date also ranks as the wettest January-to-May period in U.S. history. The nationally averaged total of 15.71” is well above the previous record of 15.13” from Jan.-May 1983. In fact, the difference of 0.58” is almost twice as big as the difference between any other two Jan.-May periods in the 125-year dataset, when arranged from dryest to wettest.
Four states—Illinois, Kansas, Nevada, and South Dakota—are having their wettest year on record to date through May, as noted by weather.com’s Brian Donegan.
The sodden May pushed the period June 2018-May 2019 into a clear first place for contiguous U.S. precipitation among all year-long time spans going back to 1895. Here is the new Top Ten list:
37.68” June 2018–May 2019
36.20” May 2018–Apr. 2019
35.95” May 2015–Apr. 2016
35.78” Apr. 2015–Mar. 2016
35.73” Mar. 2018–Feb. 2019
35.63” Feb. 1973–Jan. 1974
35.49” Apr. 2018–Mar. 2019
35.47” Jun. 1982–May 1983
35.42” May 1982–Apr. 1983
35.35” Mar. 1973–Feb. 1974
Remarkably, the last twelve months beat the previous record (set just a month ago) by a full 1.48”. None of the other margins on this top-ten list are greater than 0.25”, which speaks to the exceptional nature of just how wet it’s been nationwide. The period includes the wettest winter in U.S. history. [more]
Wettest 12 Months in U.S. History—Again
Record-setting precipitation leaves U.S. soils soggy
By Mike Carlowicz
24 May 2019
(NASA) – The continental United States recently finished its soggiest 12 months in 124 years of modern recordkeeping. The results are visible in satellite measurements of fresh water.
The continental United States recently finished its soggiest 12 months in 124 years of modern recordkeeping. The results are visible in satellite measurements of fresh water.
From 1 May 2018, to 30 April 2019, the lower 48 states collectively averaged 36.20 inches (919.48 millimeters) of precipitation, a full 6.25 inches (158.75 mm) above the mean. The previous record (April 2015 to March 2016) was 35.95 inches. According to the National Centers for Environmental Information, ten U.S. states had their wettest 12 months, and three others were in the top three. Many of them were clustered in the Mid-Atlantic and Midwest regions.
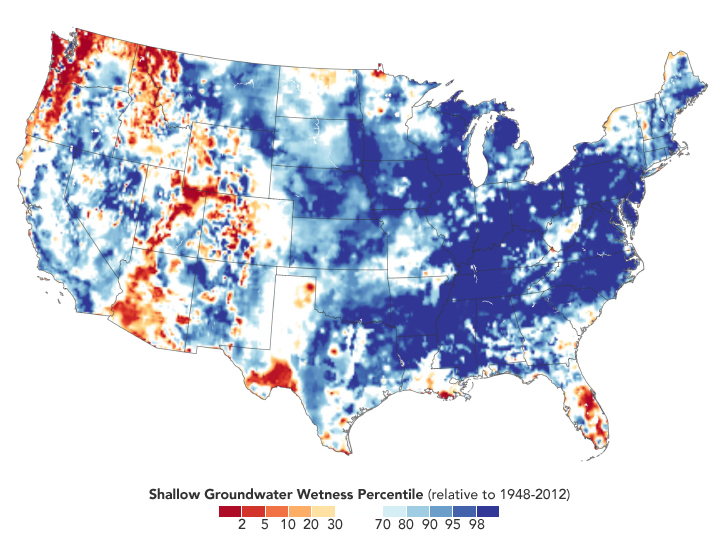
According to the 21 May 2019 report from the U.S. Drought Monitor, just 2.72 percent of the contiguous U.S. was in drought, among the lowest levels in two decades of records. California is completely out of drought for the first time since 2011. As recently as February 2018, one-third of the United States was in drought.
The map above shows how groundwater has responded to the unusually wet year. The colors depict the wetness percentile; that is, how the amount of groundwater on 13 May 2019, compares to all Mays from 1948 to 2012. Blue areas have more abundant groundwater than usual for the time of year, and orange and red areas have less. The map is based on multiple types of meteorological data (precipitation, temperature, etc.) integrated within an advanced computer model developed by scientists at NASA’s Goddard Space Flight Center. [more]