Show your stripes: Iconic global warming imagery goes local
By Bob Henson
20 June 2019
(Weather Underground) – The summer solstice arrives on Friday, 21 June 2019, and so does the second year of “warming stripes”. Launched in 2018, this growing campaign builds on a set of imagery developed by University of Reading climate scientist Ed Hawkins: colored stripes that portray a century-plus of global warming at a single glance.
This year’s campaign is taking the global trend and drilling down to individual U.S. states and cities. Climate Central has unveiled a website that allows you to generate warming stripes for 160 U.S. cities and all 50 U.S. states. The campaign has also revved up its use of social media, and dozens of broadcast meteorologists around the world will use warming stripes on air and online Friday, bringing home the reality of our warming planet.
“Meteorologists have a unique opportunity as trusted local messengers to educate audiences and help to create transformative change in a very challenging time,” said Jeff Berardelli, who coordinated last year’s effort among weathercasters, Meteorologists United on Climate Change (#MetsUnite on Twitter). After many years as a full-time broadcast meteorologist, Berardelli has shifted gears in the past year, moving to New York to produce climate-oriented segments for CBS News while working on a master’s degree focusing on climate and society at Columbia University’s Earth Institute.
“This year there will be a lot more participation as the masses join #MetsUnite to #ShowYourStripes!” said Berardelli. “Through a combined effort from Climate Central and Ed Hawkins, we have made this campaign accessible to everyone who cares about planet Earth.”
“Increasingly, the public is convinced that the climate is changing. However, they don’t always know exactly what that means for them, their family, and their community,” said Bernadette Woods Placky, who directs the Climate Matters program at Climate Central. “TV meteorologists are in a unique position to help answer those questions—to connect the dots between climate change and the increase in heavy rain, more coastal flooding, challenges to our food and water systems, longer and stronger pollen seasons, and intensifying heat that takes a toll on the health of outdoor workers and results in rearranging of our kids’ camp and sports schedules.”
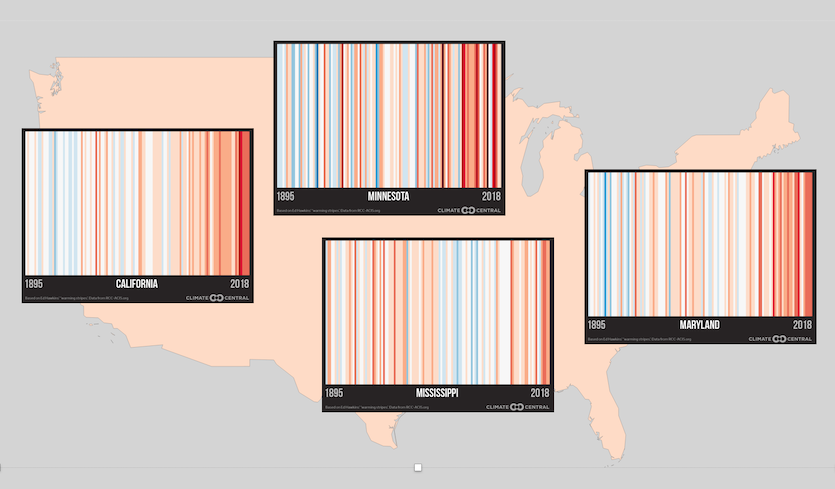
Four states, four snapshots
The image at top shows that warming across the contiguous U.S.—about 1.9°F from 1895 to 2018, which is fairly close to the global trend—hasn’t played out in the same way everywhere. The common threads are a mostly natural warming in the early 20th century, a mid-century leveling (and cooling in some areas) driven in part by postwar industry and sun-blocking pollution, and a more sustained warming in recent decades as the influence of human-produced greenhouse gases becomes ever more prominent.
All graphs below are from the NOAA National Centers for Environmental Information, with temperatures in degrees F (left) and degrees C (right). Century-scale warming rates are graphed; 30-year warming rates are given at the end of each blurb.
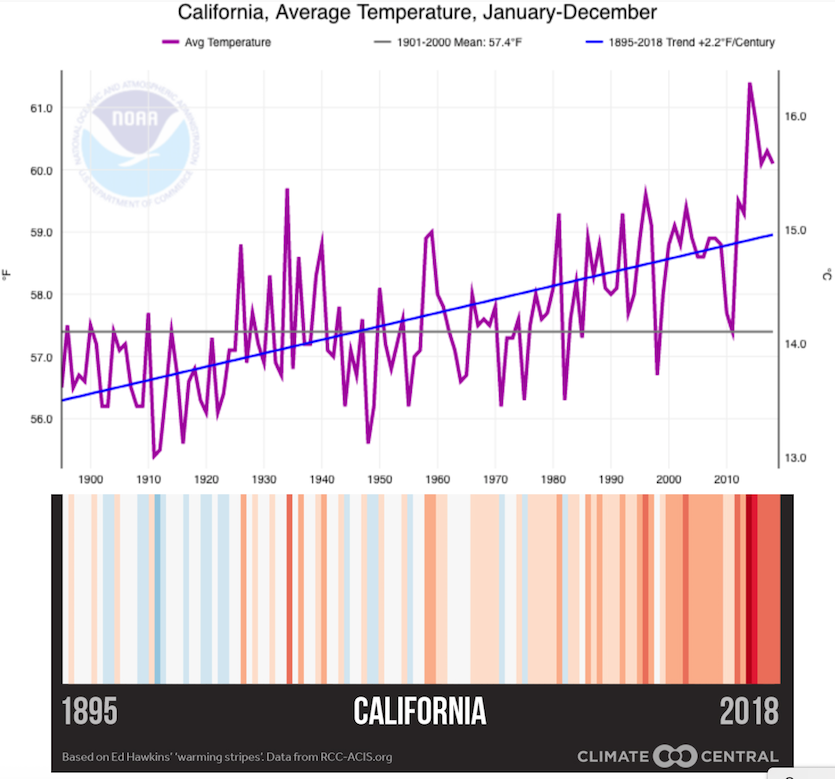
California saw fairly steady warming (with some multidecadal zigs and zags) through the 20th century, but what jumps out the most is a dramatic spike during the severe drought of the early 2010s. Research has shown that California’s droughts are now far more likely to be hot, higher-impact droughts more likely to spawn wildfires. Even during the relative mildness since 2015, California has remained consistently hotter than in any year prior to 2010.
Amount of warming per decade in the last 30 years (1988-2018): 0.6°F. [more]