Greenland ice sheet melting six times faster than in the 1980s – “It is a bit scary to see how fast it is changing”
By Rafi Letzter
23 April 2019
(Live Science) – Greenland’s ice sheet is melting six times faster than it was in the 1980s. And all that meltwater is directly raising sea levels.
That’s all according to a new study, published yesterday (22 April 2019) in the journal Proceedings of the National Academy of Sciences, that carefully reconstructs the behavior of the ice sheet in the decades before modern measurement tools became available. Scientists already knew that there was a lot more ice on Greenland in the 1970s and 1980s. And they’ve had precise measurements of the increase in melting since the 1990s. Now they know just how dramatically things have changed in the last 46 years.
“When you look at several decades, it is best to sit back in your chair before looking at the results, because it is a bit scary to see how fast it is changing,” University of California, Irvine, glaciologist Eric Rignot, a co-author of the study, said in a statement. [Image Gallery: Greenland’s Melting Glaciers] […]
In the 2000s, things dramatically accelerated.
Between 2000 and 2010, Greenland lost about 412 trillion lbs. (187 trillion kg) of ice per year. Between 2010 and 2018, the ice sheet lost roughly 631 trillion lbs. (286 trillion kilograms) of ice per year. [more]
Greenland’s Ice Sheet Was Growing. Now It’s in a Terrifying Decline
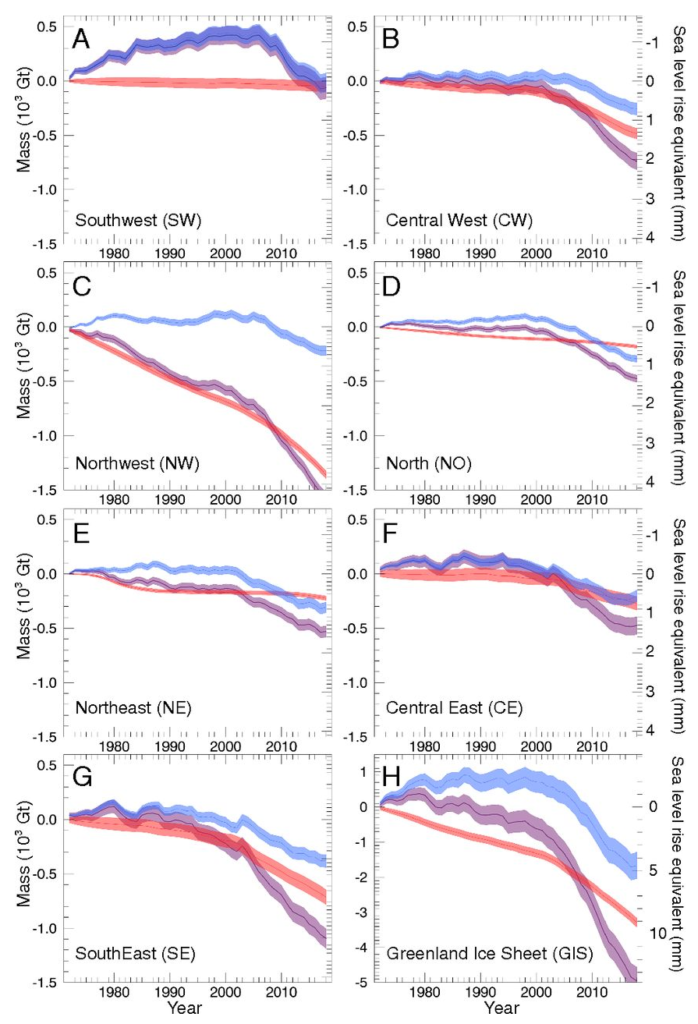
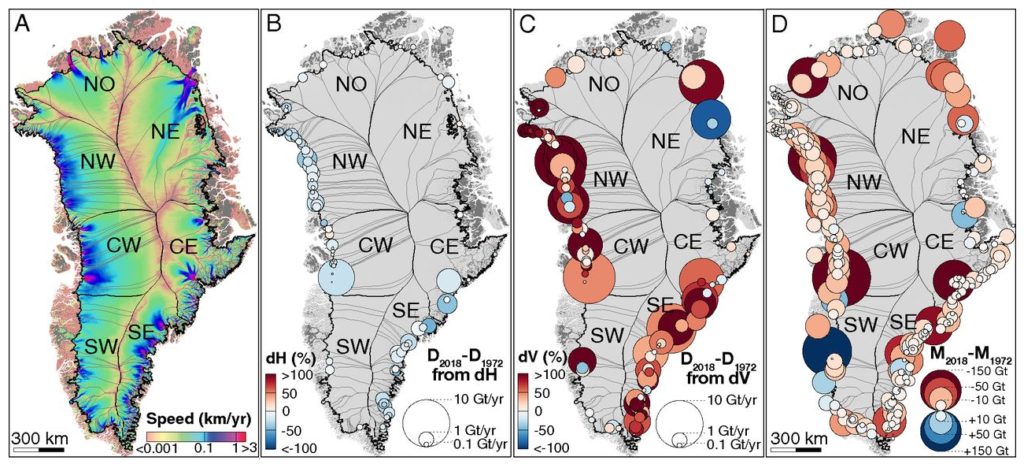
ABSTRACT: We reconstruct the mass balance of the Greenland Ice Sheet using a comprehensive survey of thickness, surface elevation, velocity, and surface mass balance (SMB) of 260 glaciers from 1972 to 2018. We calculate mass discharge, D, into the ocean directly for 107 glaciers (85% of D) and indirectly for 110 glaciers (15%) using velocity-scaled reference fluxes. The decadal mass balance switched from a mass gain of +47 ± 21 Gt/y in 1972–1980 to a loss of 51 ± 17 Gt/y in 1980–1990. The mass loss increased from 41 ± 17 Gt/y in 1990–2000, to 187 ± 17 Gt/y in 2000–2010, to 286 ± 20 Gt/y in 2010–2018, or sixfold since the 1980s, or 80 ± 6 Gt/y per decade, on average. The acceleration in mass loss switched from positive in 2000–2010 to negative in 2010–2018 due to a series of cold summers, which illustrates the difficulty of extrapolating short records into longer-term trends. Cumulated since 1972, the largest contributions to global sea level rise are from northwest (4.4 ± 0.2 mm), southeast (3.0 ± 0.3 mm), and central west (2.0 ± 0.2 mm) Greenland, with a total 13.7 ± 1.1 mm for the ice sheet. The mass loss is controlled at 66 ± 8% by glacier dynamics (9.1 mm) and 34 ± 8% by SMB (4.6 mm). Even in years of high SMB, enhanced glacier discharge has remained sufficiently high above equilibrium to maintain an annual mass loss every year since 1998.
SIGNIFICANCE: We reconstruct the mass balance of the Greenland Ice Sheet for the past 46 years by comparing glacier ice discharge into the ocean with interior accumulation of snowfall from regional atmospheric climate models over 260 drainage basins. The mass balance started to deviate from its natural range of variability in the 1980s. The mass loss has increased sixfold since the 1980s. Greenland has raised sea level by 13.7 mm since 1972, half during the last 8 years.
Forty-six years of Greenland Ice Sheet mass balance from 1972 to 2018
Researchers calculate decades of ‘scary’ Greenland ice melting
By Ivan Couronne
22 April 2019
(PhysOrg) – Measuring melting ice is a fairly precise business in 2019—thanks to satellites, weather stations and sophisticated climate models.
By the 1990s and 2000s, scientists were able to make pretty good estimates, although work from previous decades was unreliable due to less advanced technology.
Now, researchers have recalculated the amount of ice lost in Greenland since 1972, the year the first Landsat satellites entered orbit to regularly photograph the Danish territory. […]
The research team used these models to “go back in time” and reconstruct Greenland’s ice levels in the 1970s and 1980s.
The limited data available for this period—medium-quality satellite photos, aerial photos, ice cores and other observations—helped refine them.
“We added a little bit of history that did not exist,” said Rignot.
The results: during the 1970s, Greenland accumulated 47 gigatonnes of ice per year, on average. Then, it lost an equivalent volume in the 1980s.
The melting continued at that rate in the 1990s, before a sharp acceleration in the 2000s (187 Gt/year) and even more since 2010 (286 Gt/year).
Ice is melting six times faster than in the 1980s, researchers estimate—and Greenland’s glaciers alone have contributed to a 13.7 millimeter rise in sea levels since 1972, they believe.
“This is an excellent piece of work by a well-established research group using novel methods to extract more information from the available data”, said Colin Summerhayes, of the Scott Polar Research Institute in Cambridge. [more]
Researchers calculate decades of ‘scary’ Greenland ice melting