Seas are now rising faster than they have in 2,800 years, scientists say
By Chris Mooney
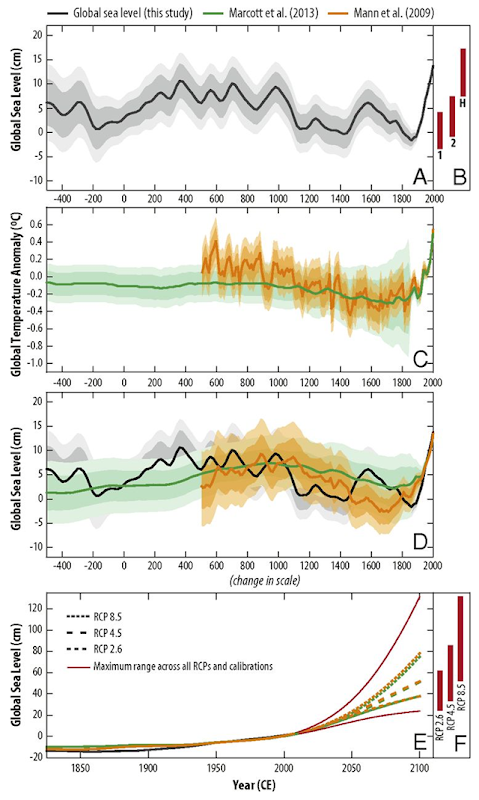
22 February 2016 (Washington Post) – A group of scientists says it has now reconstructed the history of the planet’s sea levels arcing back over some 3,000 years — leading it to conclude that the rate of increase experienced in the 20th century was “extremely likely” to have been faster than during nearly the entire period. “We can say with 95 percent probability that the 20th-century rise was faster than any of the previous 27 centuries,” said Bob Kopp, a climate scientist at Rutgers University who led the research with nine colleagues from several U.S. and global universities. Kopp said it’s not that seas rose faster before that – they probably didn’t – but merely that the ability to say as much with the same level of confidence declines. The study was published Monday in the Proceedings of the National Academy of Sciences. Seas rose about 14 centimeters (5.5 inches) from 1900 to 2000, the new study suggests, for a rate of 1.4 millimeters per year. The current rate, according to NASA, is 3.4 millimeters per year, suggesting that sea level rise is still accelerating. Unsurprisingly, the study blames the anomalous 20th-century rise on global warming — and not just that. It also calculates that, had humans not been warming the planet, there’s very little chance that seas would have risen so much during the century, finding that instead of a 14 centimeter rise, we would have seen somewhere between a 3 centimeter fall and a 7 centimeter rise. The new work is particularly significant because, in effect, the sea level analysis produces a so-called “hockey stick” graph — showing a long and relatively flat sea level “handle” for thousands of years, followed by a “blade” that turns sharply upwards in very recent times. The discovery of such patterns itself has a long history, going back to a 1998 study by climate researcher Michael Mann of Penn State University and two colleagues — who found a “hockey stick” graph for the planet’s temperature, rather than for its sea level. Since then the “hockey stick,” in its various incarnations, has come in for voluminous criticism from skeptics and doubters of human-caused climate change — even as multiple scientists have continued to affirm the conclusion that the last 100 years or so are way out of whack with what the planet has seen in the past thousand or more. The new research also forecasts that no matter how much carbon dioxide we emit, 21st-century sea level rise will still greatly outstrip what was seen in the 1900s. Nonetheless, choices made today could have a big impact. For a low emissions scenario, it finds that seas might only rise between 24 and 61 centimeters. In contrast, for a high emissions scenario — one that the recent Paris climate accord pledged the world to avert — they could rise as much as 52 to 131 centimeters, or, at the very high end, 4.29 feet. However, Kopp notes that the methods used to project these totals may not fully capture what happens over the course of this century. “We have a model that’s calibrated against a period when a certain set of processes, largely thermal expansion and glaciers, were dominant,” he says, “and we’re looking forward to a period when other factors will be dominant.” [more]
Seas are now rising faster than they have in 2,800 years, scientists say 
ABSTRACT: We assess the relationship between temperature and global sea-level (GSL) variability over the Common Era through a statistical metaanalysis of proxy relative sea-level reconstructions and tide-gauge data. GSL rose at 0.1 ± 0.1 mm/y (2σ) over 0–700 CE. A GSL fall of 0.2 ± 0.2 mm/y over 1000–1400 CE is associated with ∼0.2 °C global mean cooling. A significant GSL acceleration began in the 19th century and yielded a 20th century rise that is extremely likely (probability P≥0.95) faster than during any of the previous 27 centuries. A semiempirical model calibrated against the GSL reconstruction indicates that, in the absence of anthropogenic climate change, it is extremely likely (P=0.95) that 20th century GSL would have risen by less than 51% of the observed 13.8±1.513.8±1.5 cm. The new semiempirical model largely reconciles previous differences between semiempirical 21st century GSL projections and the process model-based projections summarized in the Intergovernmental Panel on Climate Change’s Fifth Assessment Report.
Temperature-driven global sea-level variability in the Common Era

Pretty sure Scribbler say's it's now 5mm per year and accelerating.
Won't make any difference how fast it occurs. Coastal cities are still run by not-too-bright politicians who will wait too long to abandon efforts at "stopping" the oceans from destroying their infrastructure.
"They’ll save it for as long as they can – until they can’t."
I doubt they'll be able to buy 20 years of time, but they'll sure try and waste a great deal of time and money and resources.
Points To Ponder – The Terrifying Future Facing Humanity – The Meocene