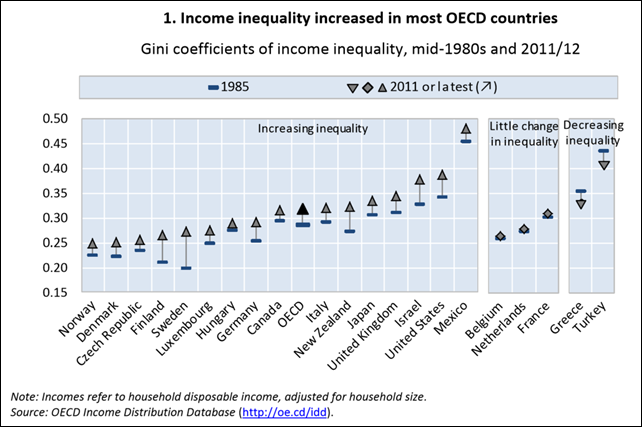
Graph of the Day: Rise of income inequality in OECD nations
9 December 2014 (OECD) – The gap between rich and poor is at its highest level in most OECD countries in 30 years. Today, the richest 10% of the population in the OECD area earn 9.5 times more than the poorest 10%. By contrast, in the 1980s the ratio stood at 7:1. The average incomes at the top of the distribution have seen particular gains. However, there have also been significant changes at the other end of the scale. In many countries, incomes of the bottom 10% of earners grew much more slowly during the prosperous years and fell during downturns, putting relative (and in some countries, absolute) income poverty on the radar of policy concerns. The increase in income inequality is evident not just in a widening gap between the top and bottom income deciles, but also in the Gini coefficient, a broader measure of inequality (which ranges from zero, where everybody has identical incomes, to 1, where all income goes to only one person). In OECD countries in the mid-1980s, the Gini measure stood at 0.29; by 2011/12, it had increased by 3 points to 0.32. The Gini coefficient increased in 16 out of the 21 OECD countries for which long time series are available, rising by more than 5 points in Finland, Israel, New Zealand, Sweden and the United States and falling slightly only in Greece and Turkey (Figure 1).
