Graph of the Day: Annual average Secchi depth at Lake Tahoe, 1967-2010
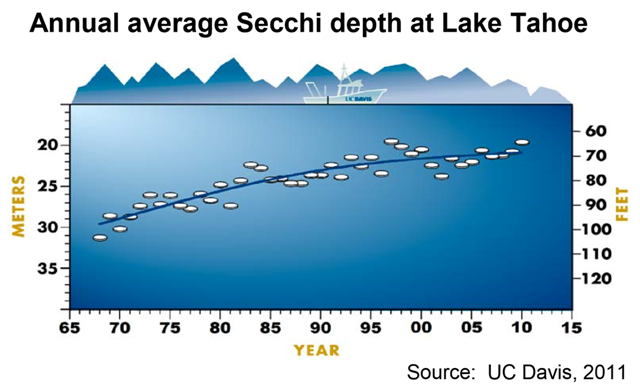
8 August 2013 (CalEPA) – This graph shows the depth below surface at which a disk (called a Secchi disk) can be seen when lowered into the lake; the clearer the waters, the greater the depth at which the disk is visible. Each value plotted is the average of 20 to 25 readings made throughout the year. In 2010, an average depth was 64.4 feet, the second shallowest depth ever recorded (the shallowest was 64.1 feet in 1997). Although lake clarity since 1968 has been declining overall, the rate of decline has slowed somewhat over the last decade, with notable differences between winter and summer clarity. Winter clarity has been showing a general improvement, while summer clarity continues to decline over the same period. Increased thermal stability in the water column appears to be producing conditions that favor small diatoms and other algae close to the surface, scattering light and decreasing transparency. Long-term monitoring data are essential for better understanding the seasonal differences and the factors affecting lake clarity (UC Davis, 2011). Lake temperature data for the lakes described here add to the body of knowledge about warming trends in lakes throughout the world. Because they are sensitive to climate, respond rapidly to change, and integrate information about changes in the land areas that drain into them (catchment), lakes serve as good sentinels for climate change. Certain changes in the physical, chemical and biological properties of lakes represent responses that are either directly influenced by climate, or are indirect changes resulting from climate influences on the land areas that drain into the lake (catchment) (Adrian, et al., 2009). Given that freshwater is one of the resources most jeopardized by a changing climate, tracking changes that are detrimental to lake water quantity or quality is critically important (Williamson, et al., 2009). A number of studies have shown that lake temperatures reflect warming trends in air temperature (Adrian et al., 2009). An analysis of the spatial patterns in lake temperature trends compared to air temperature trends for the summertime months (July through September) showed good agreement globally, although there are areas in which lake waters appear to warm more rapidly than the surrounding air temperature, such as the Great Lakes and lakes in Northern Europe (Schneider and Hook, 2010). Surface water temperatures at the six lakes presented here also appear to be warming more rapidly than the mean surface air temperature. Other investigators reported the same observation at Lake Superior (Austin and Colman, 2007). They suggested that the effect is caused by declining winter ice cover, resulting in a longer period over which the lake warms during the summer. The mean summertime air temperature trends for the study region ranged from 0.01 to 0.06oC/year, compared to the nighttime warming rates for the lakes (0.05 to 0.15oC/year) (Schneider, Hook, et al., 2009). The use of the average of all nighttime summertime temperatures for the three-month period from July through September for each year in order to assess lake temperature trends allows the annual temperature peak (around August) to be captured, while also providing a reasonably large sample size and eliminating diurnal heating. For Lake Tahoe specifically, analysis of data from the Tahoe City meteorological station showed significant increases in average summertime minimum air temperatures—0.03oC/year since 1910, and a more rapid increase of 0.06oC/year between 1992 and 2008; nighttime lake water surface temperatures, by comparison, warmed by 0.13oC/year (Mastrandrea, et al., 2009; Schneider, et al., 2009).
I have up close and personal experience with Lake Tahoe. This is where I received my diving certification in the early 1980's.
You could see the lake bottom at 100' ft or so. Diving down at 150' was very common, the water was crystal clear back then.
But development around the lake never stopped, and they ruined it as the years went by.
As the Eagles song say, calling someplace "paradise" simply means except humans to come and ruin it forever.
The "Jesus Boxes" erected in every pristine environment in the world is a testament to the real (and imagined) stupidity of humans.