Graph of the Day: Fraction of land surface at risk of severe ecosystem change as a function of global mean temperature
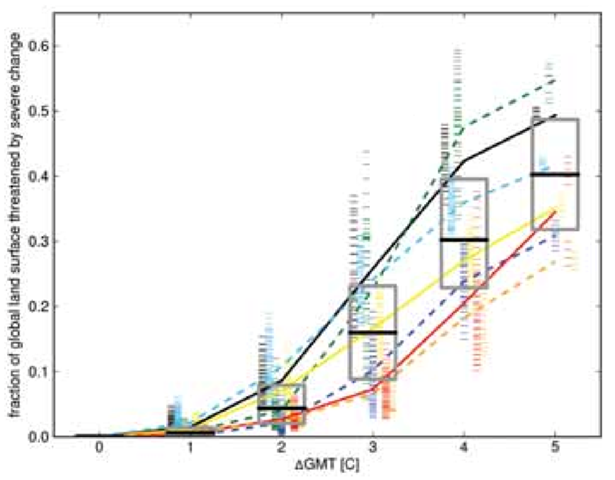
1 June 2013 (World Bank) – Climate change in the 21st century poses a large risk of change to the Earth’s ecosystems: Shifting climatic boundaries trigger changes to the biogeochemical functions and structures of ecosystems. Such changing conditions would render it difficult for local plant and animal species to survive in their current habitat. The extent to which ecosystems will be affected by future climate change depends on relative and absolute changes in the local carbon and water cycles, which partly control the composition of vegetation. Such shifts are likely to imply far-reaching transformations in the underlying system characteristics, such as species composition (Heyder, Schaphoff, Gerten, and Lucht 2011) and relationships among plants, herbivores, and pollinators (Mooney, et al. 2009); they are thus essential to understanding what constitutes “dangerous levels of global warming” with respect to ecosystems. Feedback effects can further amplify these changes, both by contributing directly to greenhouse gas emissions (Finzi, et al. 2011) and through accelerated shifts in productivity and decomposition resulting from species loss (Hooper, et al. 2012). A unified metric—which aggregates information about changes to the carbon stocks and fluxes, and to the water cycle and vegetation composition across the global land surface—is used to quantify the magnitude and uncertainty in the risk of these ecosystem changes (with respect to 1980–2010 conditions) occurring at different levels of global warming since pre-industrial times. The metric uses changes in vegetation composition as an indicator of risk to underlying plant and consumer communities. Both local (relative) and global (absolute) changes in biogeochemical fluxes and stocks contribute to the metric, as well as changes in the variability of carbon and water fluxes and stocks as an indicator of ecosystem vulnerability. The metric projects a risk of severe change for terrestrial ecosys- tems when very severe change is experienced in at least one of the metric components, or moderate to severe change in all of them. Marine ecosystems, which are not taken into account here, are further outlined in Chapter 4 on “Coastal and Marine Ecosystems.” The fraction of the global land surface at risk of severe ecosystem change is shown in Figure 6.5 for all seven models as a function of global mean temperature change above pre-industrial levels.123 Under 2°C warming, 3–7 percent of the Earth’s land surface is projected to be at risk of severe ecosystem change, although there is limited agreement among the models on which geographical regions face the highest risk of change. The extent of regions at risk of severe ecosystem change is projected to rise with changes in temperature, reaching a median value of 30 percent of the land surface under 4°C warming and increasing approximately four-fold between 2°C and 3°C. The regions projected to face the highest risk of severe ecosystem changes by 4°C include the tundra and shrub lands of the Tibetan Plateau, the grasslands of eastern India, the boreal forests of northern Canada and Russia, the savannah region in the Horn of Africa, and the Amazon rainforest. In some regions, projections of ecosystem changes vary greatly across models, with the uncertainty arising mostly from the ecosystem models themselves rather than from differences in the projections of the future climate. Global aggregations, such as reported here, should be treated cautiously, as they can obscure the fact that these arise from significantly different spatial distributions of change. Nonetheless, clear risks of biome shifts emerge when looking at the global picture, which can serve as a backdrop for more detailed assessments. The colors represent the different ecosystem models, which are also horizontally separated for clarity. Results are collated in unit-degree bins, where the temperature for a given year is the average over a 30-year window centered on that year. A black horizontal denotes the median in each bin. The grey boxes span the 25th and 75th percentiles across the entire ensemble. The short, horizontal stripes represent individual (annual) data points; the curves connect the mean value per ecosystem model in each bin. The solid (dashed) curves are for models with (without) dynamic vegetation composition changes. It is important to note that changes are compared to the present baseline.
Turn Down the Heat: Climate Extremes, Regional Impacts, and the Case for Resilience