June 19, 2012
Graph of the Day: Increases in Very Heavy Precipitation for Each U.S. Region, 1958-2007
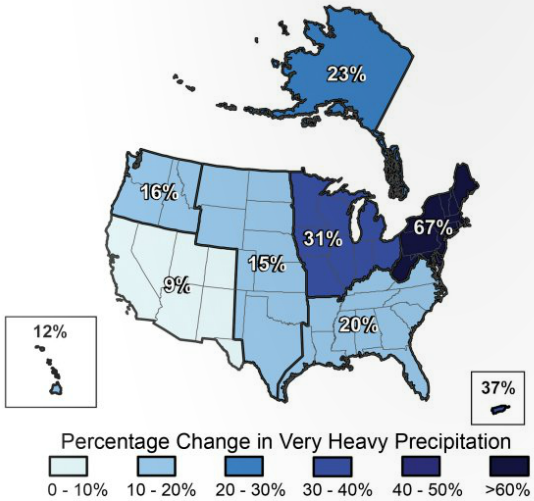
This map shows the percentage increases in very heavy precipitation (defined as the heaviest 1 percent of all event) from 1958 to 2007 for each U.S. region. There are clear trends toward more very heavy precipitation for the nation as a whole, and particularly in the Northeast and Midwest. Updated from Groisman, et al., via 350.org
http://www.latimes.com/news/nation/nationnow/la-na-nn-duluth-minnesota-rains-20120620,0,1586665.story
nice pictures