Graph of the Day: Greenland Ice Melt Area, 1979–2010
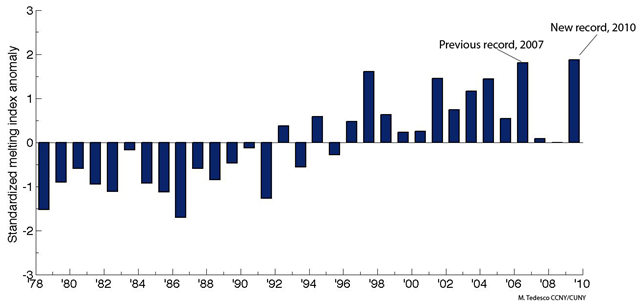
The figure shows the standardized melting index anomaly for the period 1979 – 2010. In simple words, each bar tells us by how many standard deviations melting in a particular year was above the average. For example, a value of ~2 for 2010 means that melting was above the average by two times the ‘variability’ of the melting signal along the period of observation. Previous record was set in 2007 and a new one was set in 2010. Negative values mean that melting was below the average. Note that highest anomaly values (high melting) occurred over the last 12 years, with the 8 highest values within the period 1998 – 2010. The increasing melting trend over Greenland can be observed from the figure. Over the past 30 years, the area subject to melting in Greenland has been increasing at a rate of ~ 17,000 Km2/year. This is equivalent to adding a melt-region the size of Washington State every ten years. Or, in alternative, this means that an area of the size of France melted in 2010 which was not melting in 1979.