Cold comfort: Canada’s record-smashing mildness
By Bob Henson
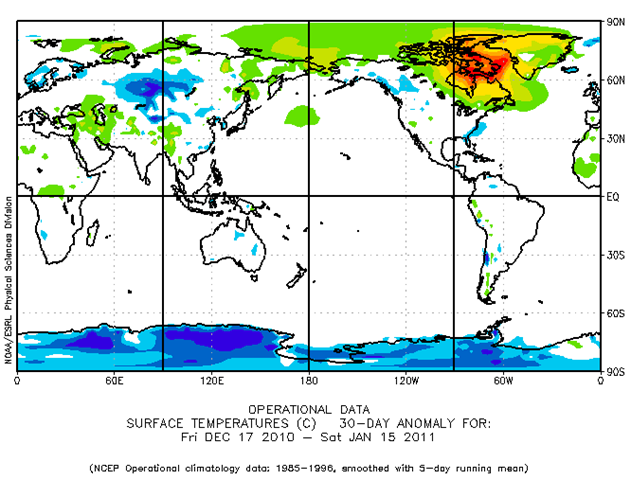
18 January 2011 Some fascinating weather has unfolded across the Northern Hemisphere over the last month, but you may have only heard about part of it. The media dutifully reported on the heavy snow that battered the mid-Atlantic and New England states in late December. It was also the United Kingdom’s coldest December in at least the last century. Meanwhile, the sparsely populated Canadian Arctic basked in near-unprecedented mildness. It’s the second chapter of a tale that began a year ago, when Canada as a whole saw the warmest and driest winter in its history. Much of the blame went to El Niño, which typically produces warmer-than-average weather across Canada. So far, so good—but similar things are happening this winter, even with a La Niña now at the helm. Just how mild has it been? The map above shows departures from average surface temperatures for the period from 17 December 2010 to 15 January 2011, as calculated by NOAA’s Earth Systems Research Laboratory. The blue blip along the southeast U.S. coast indicates readings between 3°C and 6°C (5.4–10.8°F) below average for the 30-day period as a whole. That’s noteworthy—and in fact, it was the coldest December in more than a century of record-keeping across south Florida (see PDF summary). Blue also shows up across the UK, where December averaged 5.2°C (9.4°F) below normal.What really jumps out, though, is a blob of green, yellow, orange, and red covering a major swath of northern and eastern Canada. The largest anomalies here exceed 21°C (37.8°F) above average, which are very large values to be sustained for an entire month. To put this picture into even sharper focus, let’s take a look at Coral Harbour, located at the northwest corner of Hudson Bay in the province of Nunavut. On a typical mid-January day, the town drops to a low of –34°C (–29.2°F) and reaches a high of just -26°C (–14.8°F). Compare that to what Coral Harbour actually experienced in the first twelve days of January 2011, as reported by Environment Canada (see table at right).
- After New Year’s Day, the town went 11 days without getting down to its average daily high.
- On the 6th of the month, the low temperature was –3.7°C (25.3°F). That’s a remarkable 30°C (54°F) above average.
- On both the 5th and 6th, Coral Harbor inched above the freezing mark. Before this year, temperatures above 0°C (32°F) had never been recorded in the entire three months of January, February, and March. …