August 3, 2010
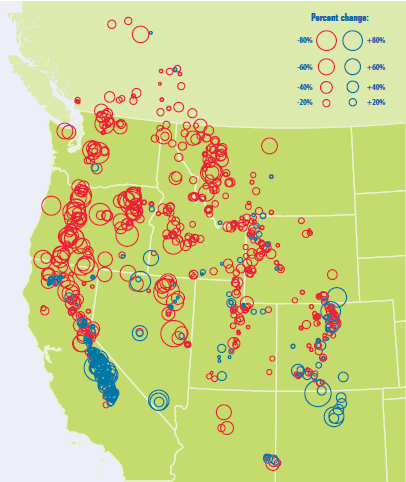
Graph of the Day: Trends in April Snowpack in the Western US and Canada, 1950–2000
This map shows trends in snow water equivalent in the western United States and part of Canada. Negative trends are shown by red circles and positive trends by blue. • From 1950 to 2000, April snow water equivalent declined at most of the measurement sites (see Figure 1), with some relative losses exceeding 75 percent. • In general, the largest decreases were observed in western Washington, western Oregon, and northern California. April snowpack decreased to a lesser extent in the northern Rockies. • A few areas have seen increases in snowpack, primarily in the southern Sierra Nevada of California and in the Southwest.
Climate Change Indicators in the United States [pdf]
Technorati Tags: North America,global warming,climate change,drought,freshwater depletion,agriculture,Canada
