May 26, 2009
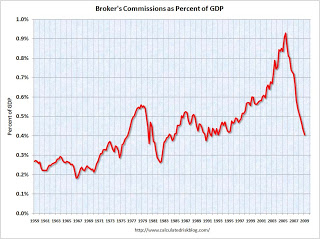
Graph of the Day: Real Estate Broker Commissions, 1959-2009
From Calculated Risk: 
This graph shows broker’s commissions as a percent of GDP. Not surprisingly – giving the housing bubble – broker’s commissions soared in recent years, rising from $56 billion in 2000, to $109 billion in 2005. Commissions have declined to an annual rate of $57 billion in Q1 2009 – the lowest since 2000. As a percent of GDP (shown on graph), broker’s commissions are at the lowest level since 1993. All data from the BEA. …
Technorati Tags: financial collapse
Love your blog, have to see what I missed. The ultimate in penultimate.
Here’s one of mine you’re free to use: recent US natural gas rig count, from Baker Hughes data: http://img200.imageshack.us/img200/8932/usngrigcount.png
Looks suspiciously akin to the chart of recent crude prices, i.e., as was said about the crash in the DJIA last fall, “like someone walked up to the market and shot it in the head.”