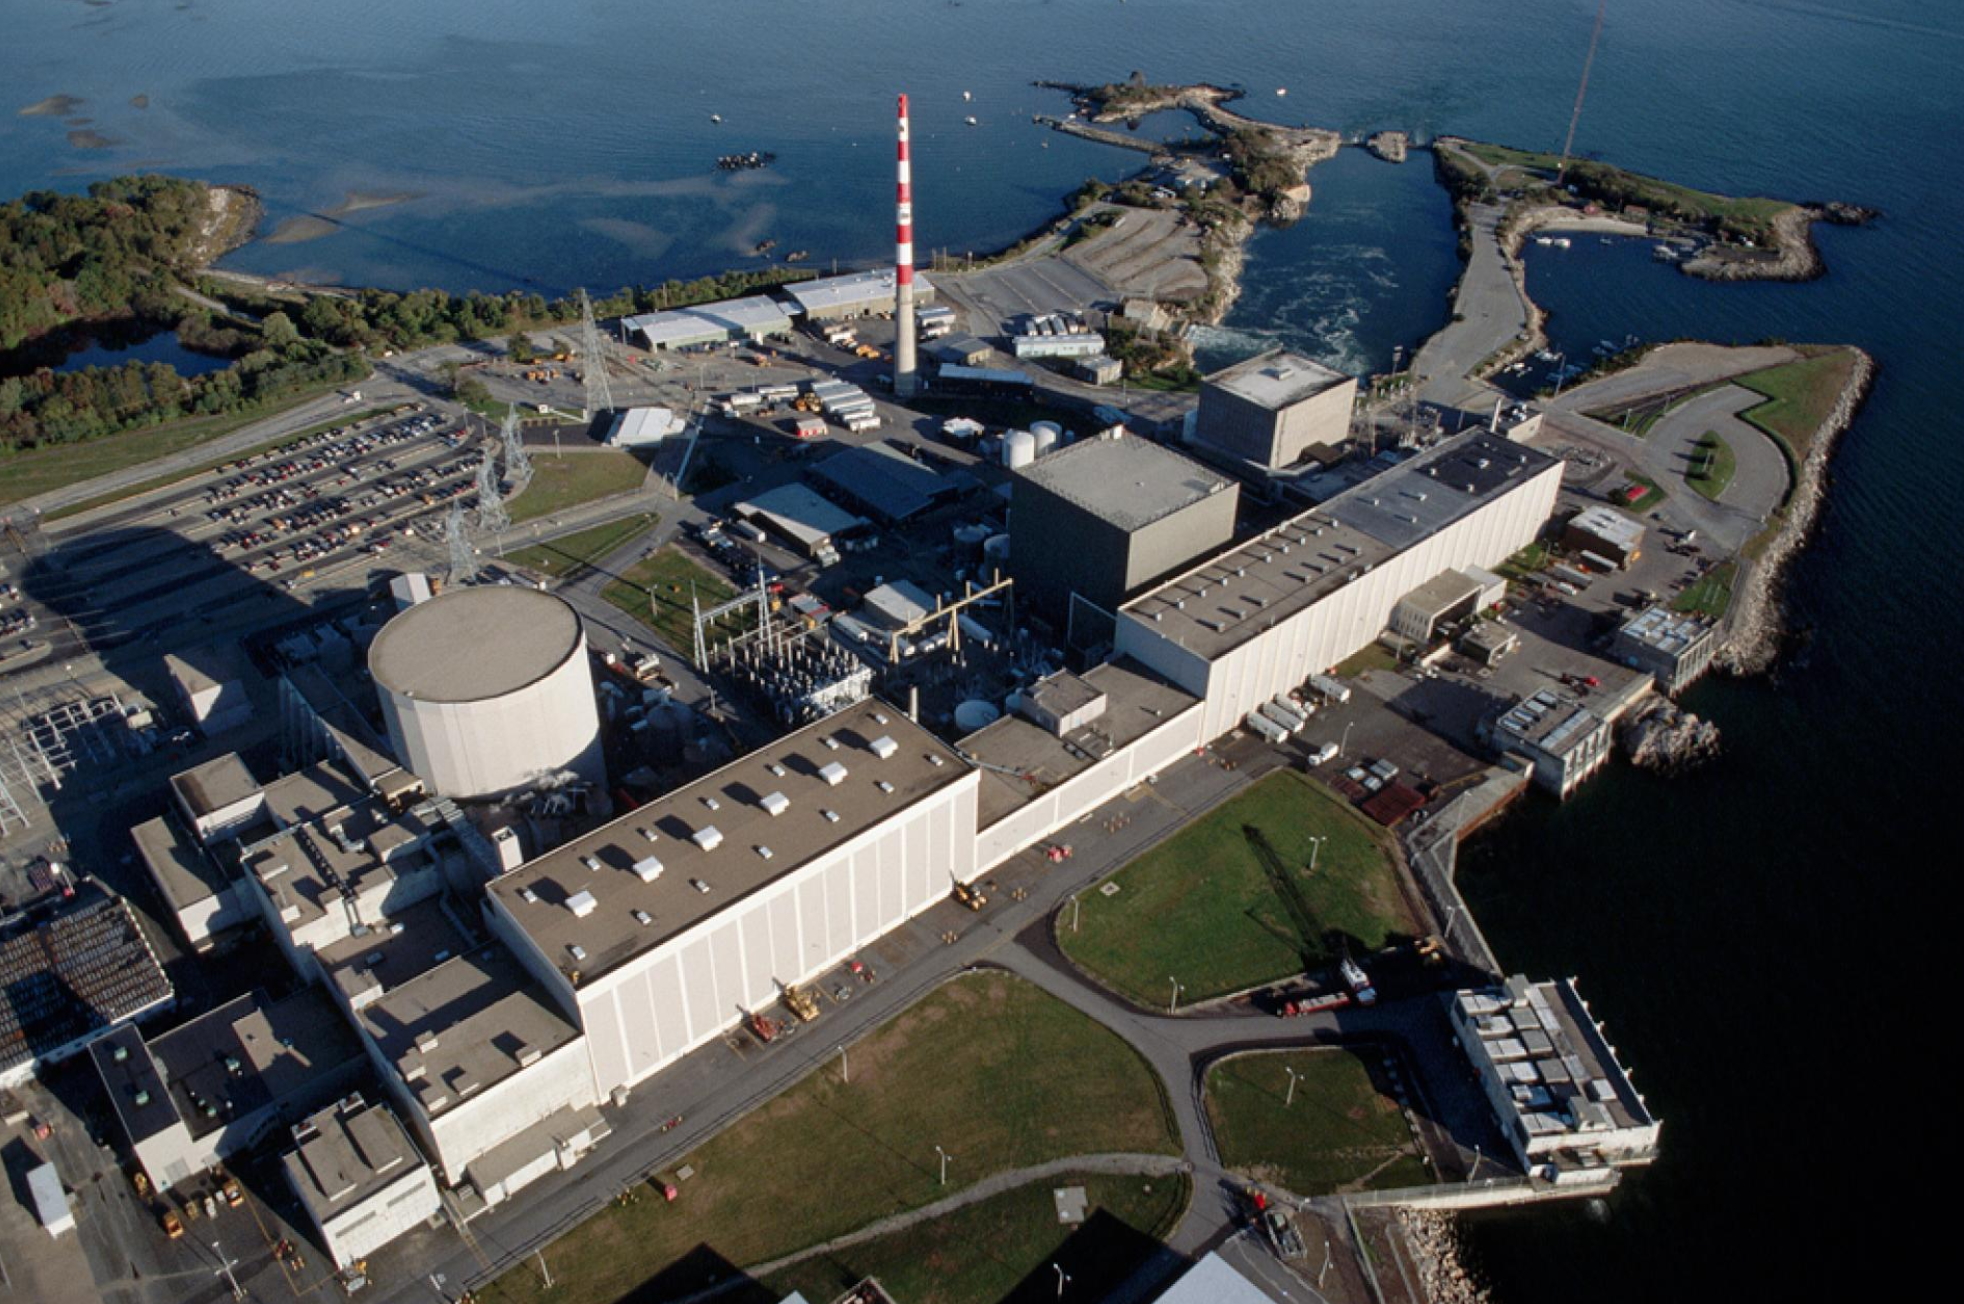
By Alan Neuhauser 1 July 2019 (US News) – There’s a reason nuclear plants are built close to water. Harnessing the enormous power of nuclear fission, plants generate steam, which shoots through pipes to spin a turbine that generates massive amounts of electricity. To keep from getting dangerously hot, the plants suck up surrounding water […]
22 July 2019 (AFP) – Parisians were bracing on Monday for potentially the hottest ever temperature in the French capital this week as a new heatwave blasted into northern Europe that could set records in several countries. Temperatures were already topping 30 degrees Celsius (86 degrees Fahrenheit) on Monday in Paris, but the mercury could […]
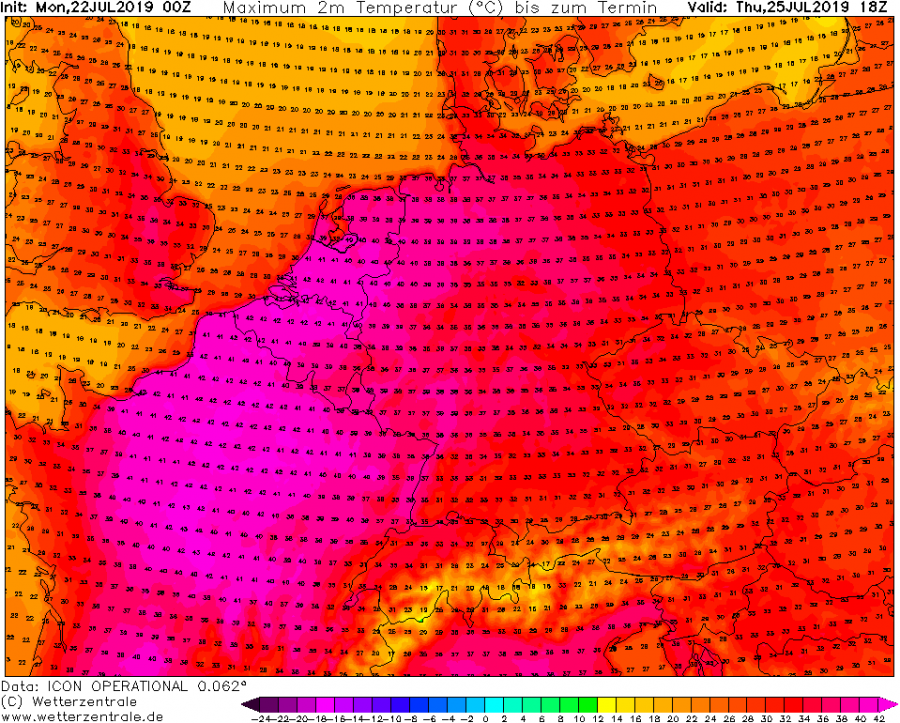
22 July 2019 (The Local) – Temperatures could exceed 38C in some parts of the Bundesrepublik this week during a record fourth summer heat wave. On Thursday temperatures around Germany will spike to up 38C – reigning in the fourth heat wave of the summer. Due to climate change, says Latif, there is double the […]
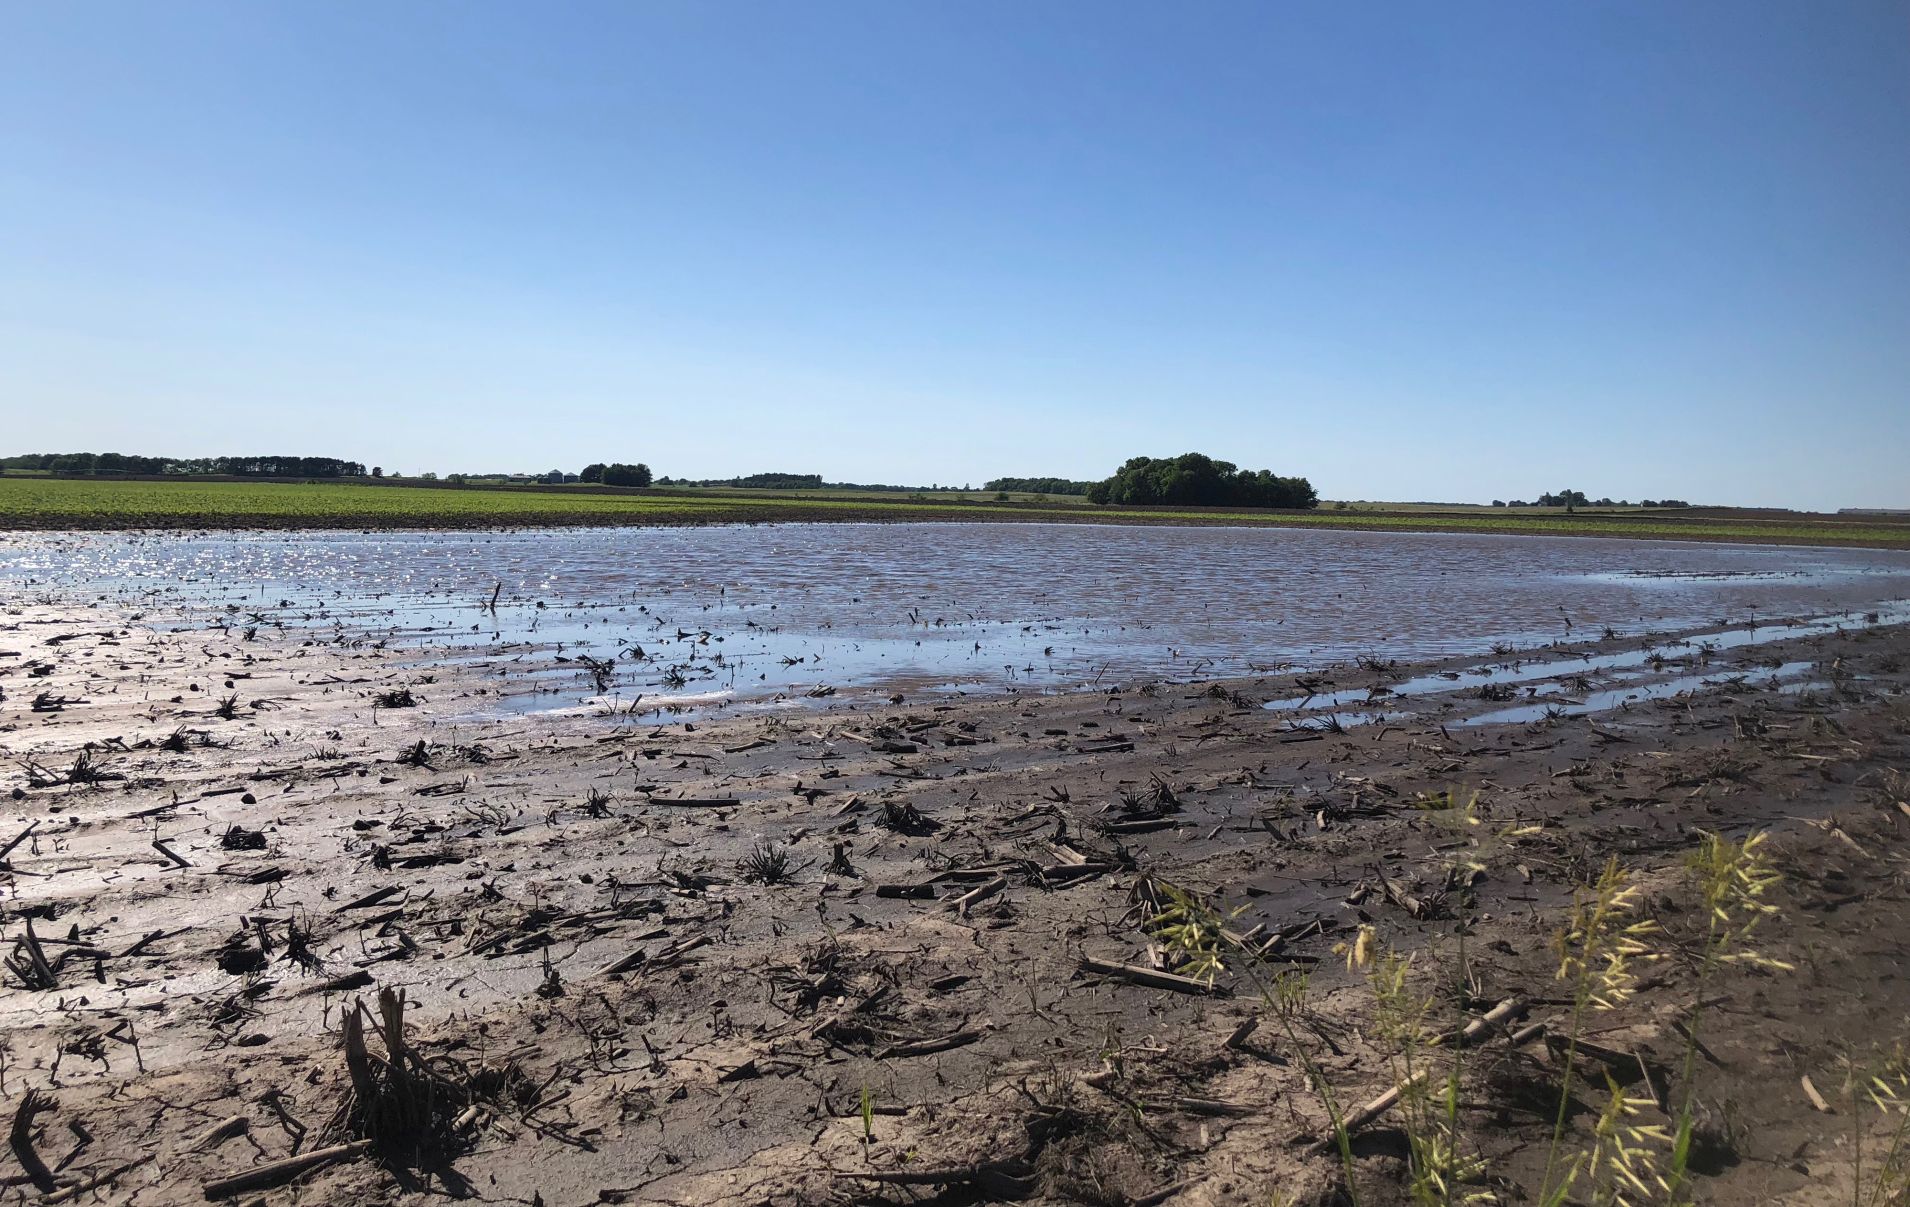
By Emma Newburger 20 July 2019 (CNBC) – In the past year, torrential rains have dumped water on U.S. farmlands, destroying acreage and delaying crops from getting planted on time. Now, farmers face another hurdle: a stifling heat wave that’s spreading across the United States and is expected to be the worst in the farm […]
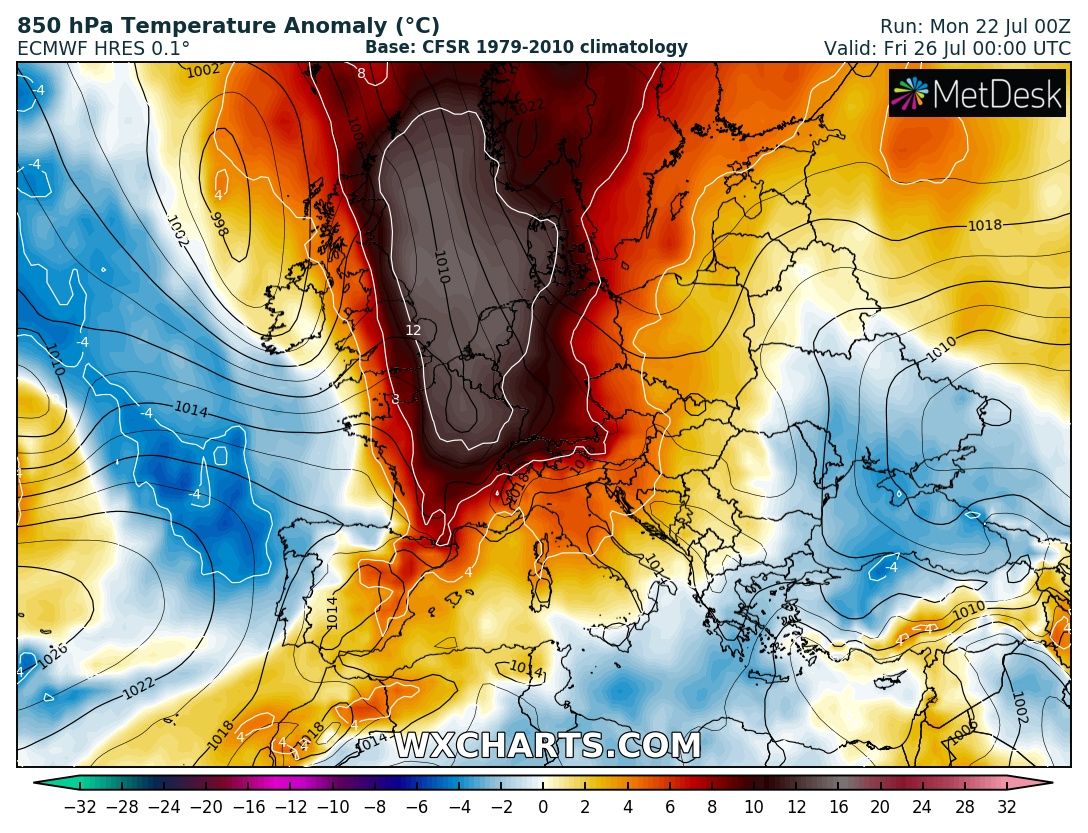
22 July 2019 (SWE) – A development of another potentially record-breaking heat wave is expected this week. Again, similar to the late June intense and record-breaking heat wave for S France, extreme heat will spread across western Europe. We could actually see additional new record-breaking temperature values, precisely across parts of NE France, Benelux and […]
14 July 2019 (The Siberian Times) – Today it’s +32°C (89.6°F) in Yakutsk, the world’s coldest city, and locals escape heatwave like true Siberians – by chilling on ice. Today the Buluus glacier is as packed with visitors as the only official beach in Yakutsk, the world’s largest city built on permafrost. A hidden gem […]
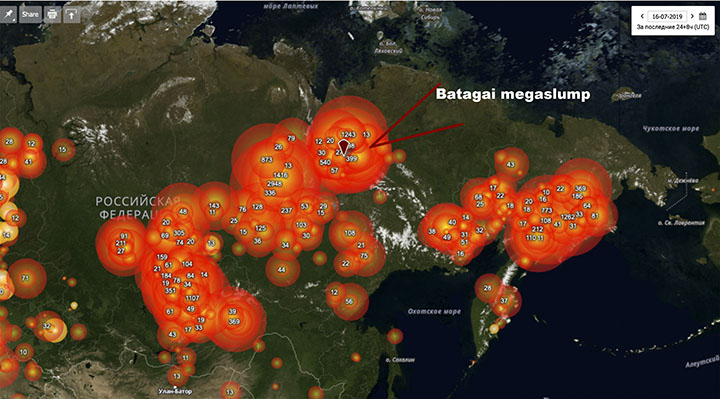
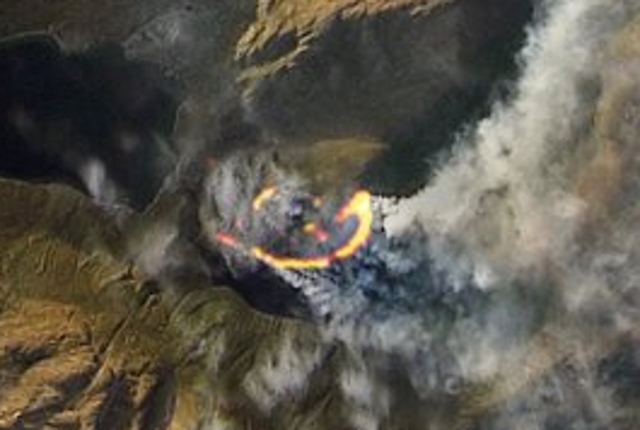
16 July 2019 (The Siberian Times) – After a month of warm, dry weather and wildfires, the huge crater nicknamed ‘Mouth of Hell’ is now under direct threat. The fear is that flames burning on the rim of the depression will weaken the permafrost and cause a major enlargement of the Batagai or Batagaika ‘megaslump’, […]
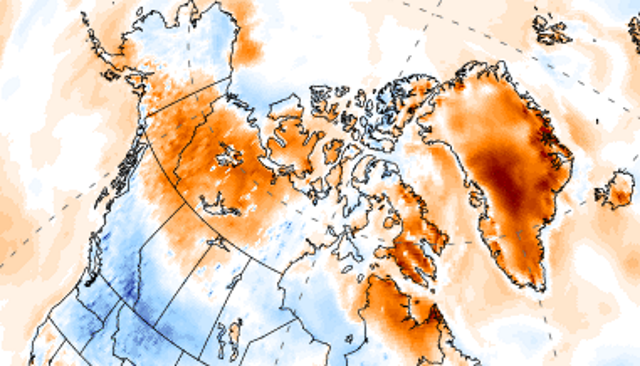
By Brian Kahn 18 July 2019 (Gizmodo) – Vast stretches of Earth’s northern latitudes are on fire right now. Hot weather has engulfed a huge portion of the Arctic, from Alaska to Greenland to Siberia. That’s helped create conditions ripe for wildfires, including some truly massive ones burning in remote parts of the region that […]
By Bob Weber 15 July 2019 (The Canadian Press) – Weather watchers are focused on the world’s most northerly community, which is in the middle of a record-breaking heat wave. “It’s really quite spectacular,” said David Phillips, Environment Canada’s chief climatologist. “This is unprecedented.” The weather agency confirmed that Canadian Forces Station Alert hit a record […]
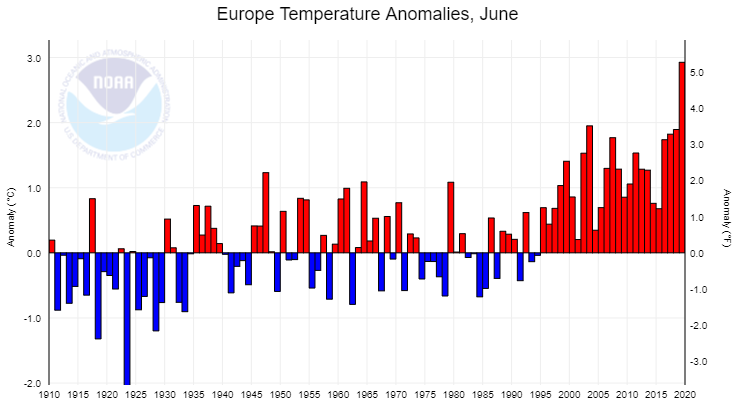
By Dr. Jeff Masters 18 July 2019 (Weather Underground) – June 2019 was the planet’s warmest June since record keeping began in 1880, said NOAA’s National Centers for Environmental Information (NCEI) on Tuesday. NASA also rated June 2019 as the warmest June on record, well of ahead of the previous record set in 2015. The global heat in June […]