Graph of the Day: Atmospheric Carbon Dioxide and Methane, 1983-2008
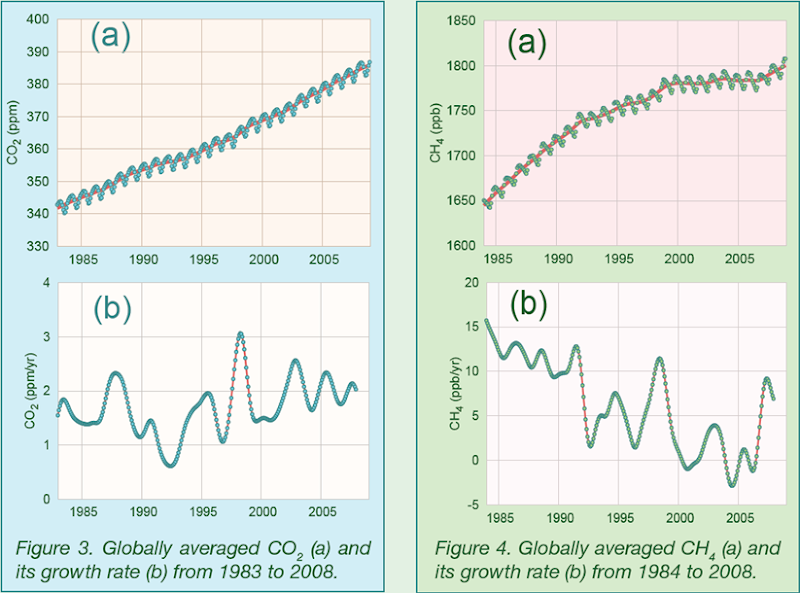
CO2 is the single most important human-emitted greenhouse gas in the atmosphere, contributing 63.5 %(2) to the overall global radiative forcing. However, it is responsible for 85% of the increase in radiative forcing over the past decade and 86% over the last five years. For about 10,000 years before the industrial revolution, the atmospheric abundance of CO2 was nearly constant at ~ 280 ppm (ppm = number of molecules of the gas per million molecules of dry air). This abundance represented a balance between the atmosphere, the oceans and the biosphere. Since 1750, atmospheric CO2 has increased by 38%, primarily because of emissions from combustion of fossil fuels (8.62 Gt carbon in 2007) and deforestation and land use change (0.5-2.5 Gt carbon per year over the 2000-2005 time period). High-precision measurements of atmospheric CO2 beginning in 1958 show that the average increase of CO2 in the atmosphere corresponds to ~ 55% of the CO2 emitted by fossil fuel combustion. The remaining fossil fuel-CO2 has been removed from the atmosphere by the oceans and the terrestrial biosphere. Globally averaged CO2 in 2008 was 385.2 ppm and the increase from the year before was 2.0 ppm (Figure 3). This growth rate is larger than the average for the 1990s (~1.5 ppm/yr), mainly because of increasing emissions of CO2 from fossil fuel combustion. Methane contributes 18.2 %(2) to the overall global radiative forcing. Methane is emitted to the atmosphere by natural (~ 40%, e.g., wetlands and termites) and anthropogenic sources (~ 60%, e.g., ruminants, rice agriculture, fossil fuel exploitation, landfills and biomass burning). It is removed from the atmosphere primarily by reaction with the hydroxyl radical (OH). Before the industrial era, atmospheric methane was at ~ 700 ppb (ppb = number of molecules of the gas per billion (109) molecules of dry air). Increasing emissions from anthropogenic sources are responsible for the 157% increase in CH4. Globally averaged CH4 in 2008 was 1797 ppb, which means an increase of 7 ppb from the year before. It exceeds the highest annual mean abundance recorded so far, which was in 2007 (Figure 4). Methane was increasing by up to 13 ppb per year during the late 1980s, while the growth rate decreased during the past decade. The 7 ppb rise from 2007 to 2008 follows the 7 ppb rise the previous year and they represent the highest annual increases since 1998. From the existing data it is not clear if this 14 ppb increase over two years represents the beginning of a new upward trend in CH4. In order to improve our understanding of the processes that affect CH4 emissions more in situ measurements would be needed close to the source regions. …

Climategate was forecast…
“What is the current scientific consensus on the conclusions reached by Drs. Mann, Bradley and Hughes? [Referring to the hockey stick propagated in UN IPCC 2001 by Michael Mann and debunked by McIntyre and McKitrick in 2003.]
Ans: Based on the literature we have reviewed, there is no overarching consensus on MBH98/99. As analyzed in our social network, there is a tightly knit group of individuals who passionately believe in their thesis. However, our perception is that this group has a self-reinforcing feedback mechanism and, moreover, the work has been sufficiently politicized that they can hardly reassess their public positions without losing credibility.”
AD HOC COMMITTEE REPORT ON THE ‘HOCKEY STICK’ GLOBAL CLIMATE RECONSTRUCTION, also known as The Wegman report was authored by Edward J. Wegman, George Mason University, David W. Scott, Rice University, and Yasmin H. Said, The Johns Hopkins University with the contributions of John T. Rigsby, III, Naval Surface Warfare Center, and Denise M. Reeves, MITRE Corporation.
Refuting claims that the hockey stick is broken
National Research Council vindicates the 'hockey stick' graph
Climate Cover-Up: The Crusade to Deny Global Warming