August 8, 2010
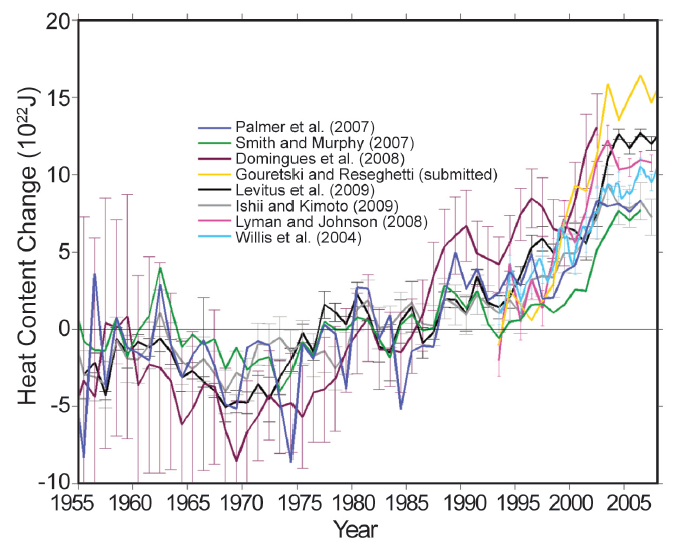
Graph of the Day: Ocean Heat Content Anomaly, 1955-2007
XBT corrected estimates of annual ocean heat content anomaly (1022 J) for the 0–700 m layer. Differences among the time series arise from: input data; quality control procedure; gridding and infilling methodology (what assumptions are made in areas of missing data); bias correction methodology; and choice of reference climatology. Anomalies are computed relative to the 1955–2002 average. Figure reproduced from Palmer et al. (2010).
State of the Climate in 2009, National Oceanic and Atmospheric Administration, National Climatic Data Center, as appearing in the June 2010 issue (Vol. 91) of the Bulletin of the American Meteorological Society (BAMS). [pdf]
