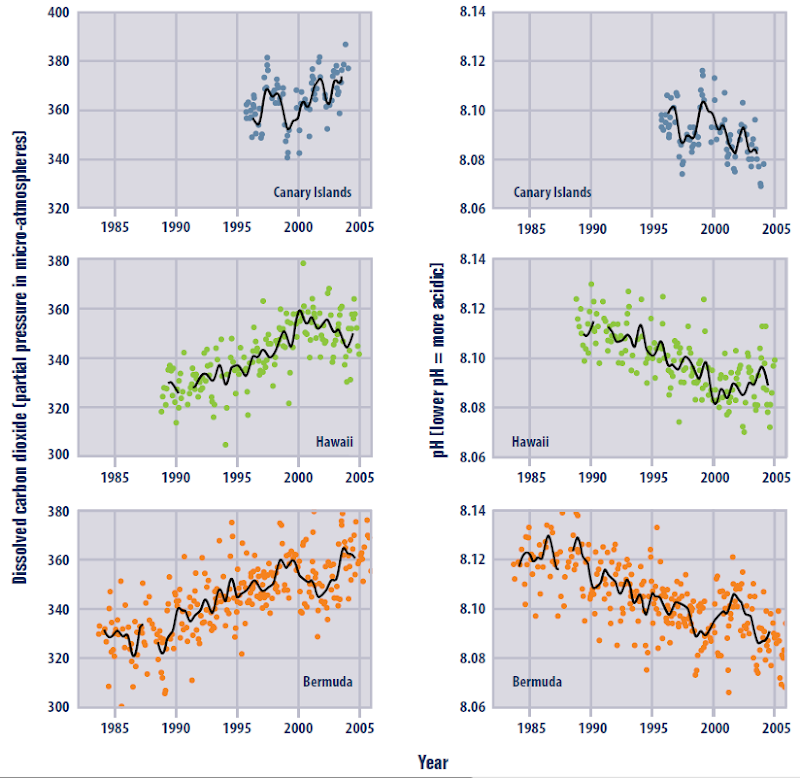
Graph of the Day: Ocean Carbon Dioxide Levels and Acidity, 1983–2005
This figure shows changes in ocean carbon dioxide levels (measured as a partial pressure) and acidity (measured as pH). The data come from two observation stations in the North Atlantic Ocean (Canary Islands and Bermuda) and one in the Pacific (Hawaii). Dots represent individual measurements, while the lines represent smoothed trends. Measurements made over the last few decades have demonstrated that ocean carbon dioxide levels have risen, accompanied by an increase in acidity (that is, a decrease in pH). Direct observations show that pH levels fluctuate more frequently in some areas of the ocean than in others. More measurements are needed to better understand the links between these natural fluctuations and long-term changes in ocean acidity.
Climate Change Indicators in the United States [pdf]
