Graph of the Day: Total Cost of New Policies under Bush and Obama
By James Fallows
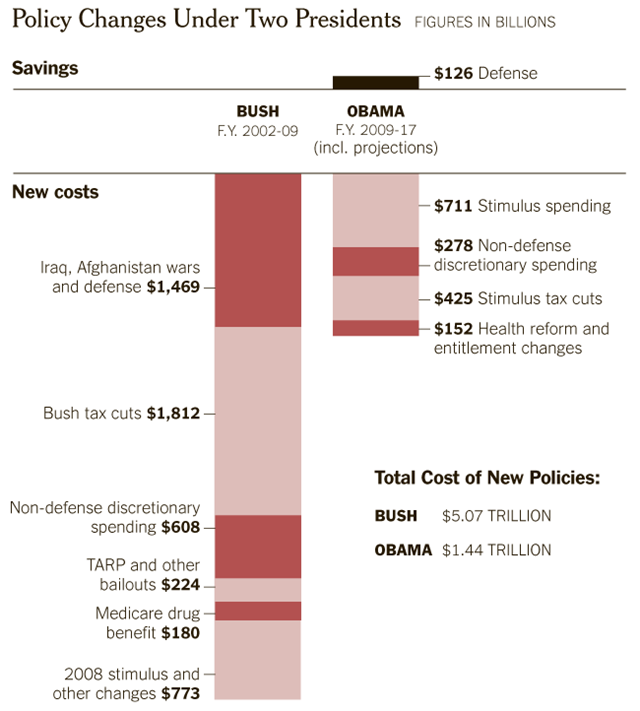
25 July 2011 The Chart That Should Accompany All Discussions of the Debt Ceiling It’s this one, from yesterday’s New York Times. Click for a more detailed view, though it’s pretty clear as is. It’s based on data from the Congressional Budget Office and the Center on Budget and Policy Priorities. Its significance is not partisan (who’s “to blame” for the deficit) but intellectual. It demonstrates the utter incoherence of being very concerned about a structural federal deficit but ruling out of consideration the policy that was largest single contributor to that deficit, namely the Bush-era tax cuts. An additional significance of the chart: it identifies policy changes, the things over which Congress and Administration have some control, as opposed to largely external shocks — like the repercussions of the 9/11 attacks or the deep worldwide recession following the 2008 financial crisis. Those external events make a big difference in the deficit, and they are the major reason why deficits have increased faster in absolute terms during Obama’s first two years than during the last two under Bush. (In a recession, tax revenues plunge, and government spending goes up – partly because of automatic programs like unemployment insurance, and partly in a deliberate attempt to keep the recession from getting worse.) If you want, you could even put the spending for wars in Iraq and Afghanistan in this category: those were policy choices, but right or wrong they came in response to an external shock. The point is that governments can respond to but not control external shocks. That’s why we call them “shocks.” Governments can control their policies. And the policy that did the most to magnify future deficits is the Bush-era tax cuts. You could argue that the stimulative effect of those cuts is worth it (“deficits don’t matter”, etc). But you cannot logically argue that we absolutely must reduce deficits, but that we absolutely must also preserve every penny of those tax cuts. Which I believe precisely describes the House Republican position. After the jump, from a previous “The Chart That Should…” positing, an illustration of the respective roles of external shock and deliberate policy change in creating the deficit. […]
The Chart That Should Accompany All Discussions of the Debt Ceiling