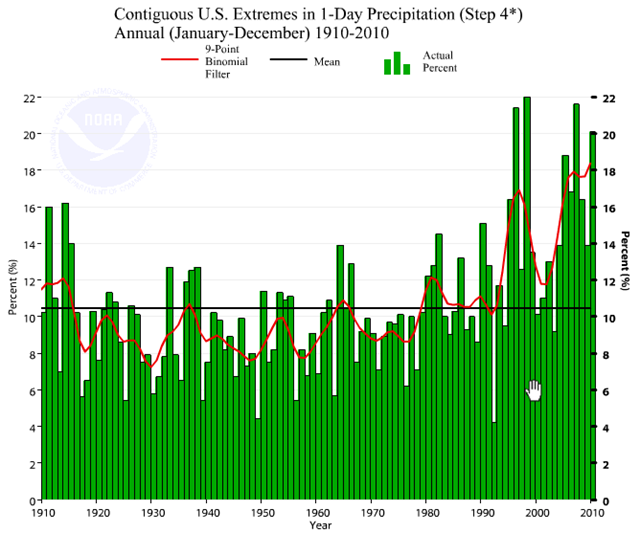
Graph of the Day: U.S. Extremes in 1-Day Precipitation, 1910-2010
Created by Jesse Enloe, Jesse.Enloe@noaa.gov
How has the climate changed over the past 50 or more years? In what ways and by how much? Many people, including climatologists, have been struggling with these questions for some time now, not only for scientific interest, but also to aid in policy decisions (IPCC 2001) and to inform the general public. In order to answer these questions, it is important to obtain comprehensive and intuitive information which allows interested parties to understand the scientific basis for confidence, or lack thereof, in the present understanding of the climate system. One tool, first developed as a framework for quantifying observed changes in climate within the contiguous Unites States, is the U.S. Climate Extremes Index (CEI). The CEI was first introduced in early 1996 (Karl, et al. 1996) with the goal of summarizing and presenting a complex set of multivariate and multidimensional climate changes in the United States so that the results could be easily understood and used in policy decisions made by nonspecialists in the field. The contiguous U.S. was selected as the focus for this study in part since climate change is of great interest to U.S. citizens and policy makers and since climate changes within the U.S. have not been given extensive coverage in intergovernmental or national reports which focus on climate change assessments (IPCC 2001; NRC 1992; NRC 2001). Definition The U.S. CEI is the arithmetic average of the following five or six# indicators of the percentage of the conterminous U.S. area:
- The sum of (a) percentage of the United States with maximum temperatures much below normal and (b) percentage of the United
- States with maximum temperatures much above normal.
The sum of (a) percentage of the United States with minimum temperatures much below normal and (b) percentage of the United States with minimum temperatures much above normal.- The sum of (a) percentage of the United States in severe drought (equivalent to the lowest tenth percentile) based on the PDSI and (b) percentage of the United States with severe moisture surplus (equivalent to the highest tenth percentile) based on the PDSI.
- Twice the value of the percentage of the United States with a much greater than normal proportion of precipitation derived from extreme (equivalent to the highest tenth percentile) 1-day precipitation events.
- The sum of (a) percentage of the United States with a much greater than normal number of days with precipitation and (b) percentage of the United States with a much greater than normal number of days without precipitation.
- *The sum of squares of U.S. landfalling tropical storm and hurricane wind velocities scaled to the mean of the first five indicators.
The Y axis is in percentages and I can't tell from the article what they are percentages of.
Right you are — I've appended the definition.