Graph of the Day: Australia Rainfall Deciles, 1 January 1997 – 31 December 2011
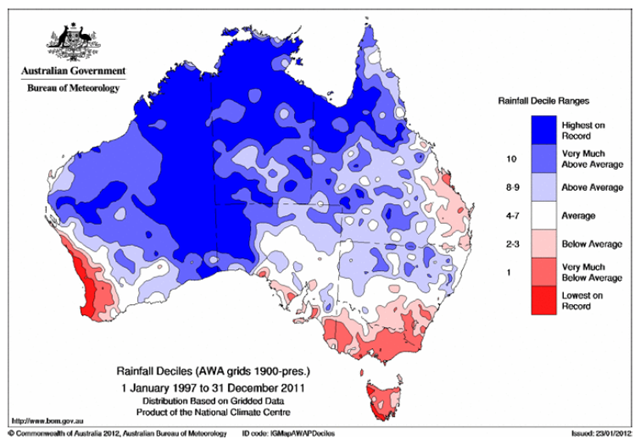
In light of the exceptionally wet two-year period (2010–2011) we have updated maps from the Special Climate Statement 22 which previously reported on the extended dry in southern areas. Arguably, and by many measures such as increases in soil moisture, refilling of dams, and frequent flooding etc., the long dry can now be said to be over. This is certainly true of the northern parts of the Murray-Darling Basin where severe drought conditions have given way to flooding. However, the 15-year and the 10-year rainfall decile maps (Figures 3 and 4) show that over much of southeastern Australia and southwestern Australia large areas of below-average and very-much-below-average rainfall remain, while pockets of record-low 15-year totals are evident along the coast in southwest WA, western Tasmania and parts of Victoria including near the catchments for Melbourne. With the longer 15-year period (Figure 3), 56% of Victoria and 74% of Tasmania remains in the lowest rainfall decile. With the shorter 10-year period (Figure 4), large areas of below-average rainfall also remain evident with 40% of Victoria and 39% of Tasmania in the lowest decile. The updated long-term deficiency maps reflect just how extreme and prolonged the dry period was over southern parts of Australia leading into 2010–2011. This continues to be significant for these regions; given that almost all of the excessive rainfall over the past two years fell out of season, and that long term declines in autumn and winter rainfall remain.
National Climate Centre, Bureau of Meteorology, 2012. Australia’s wettest two-year period on record; 2010–2011. Special Climate Statement 38. [pdf].