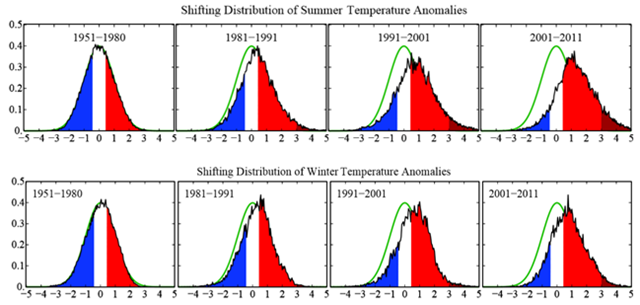
Graph of the Day: Shifting Distribution of Global Temperature Anomalies, 1981-2011
Frequency of occurrence (y-axis) of local temperature anomalies divided by local standard deviation (x-axis) obtained by binning all local results for the indicated region and 11-year period into 0.05 frequency intervals. Area under each curve is unity. Standard deviations are for the 1951-1980 period. ABSTRACT: “Climate dice,” describing the chance of unusually warm or cool seasons, have become more and more “loaded” in the past 30 years, coincident with rapid global warming. The distribution of seasonal mean temperature anomalies has shifted toward higher temperatures and the range of anomalies has increased. An important change is the emergence of a category of summertime extremely hot outliers, more than three standard deviations (3σ) warmer than the climatology of the 1951–1980 base period. This hot extreme, which covered much less than 1% of Earth’s surface during the base period, now typically covers about 10% of the land area. It follows that we can state, with a high degree of confidence, that extreme anomalies such as those in Texas and Oklahoma in 2011 and Moscow in 2010 were a consequence of global warming because their likelihood in the absence of global warming was exceedingly small. We discuss practical implications of this substantial, growing, climate change.

I don't see many comments on your blog, but please accept my appreciation for the time you spend finding and presenting these stories.