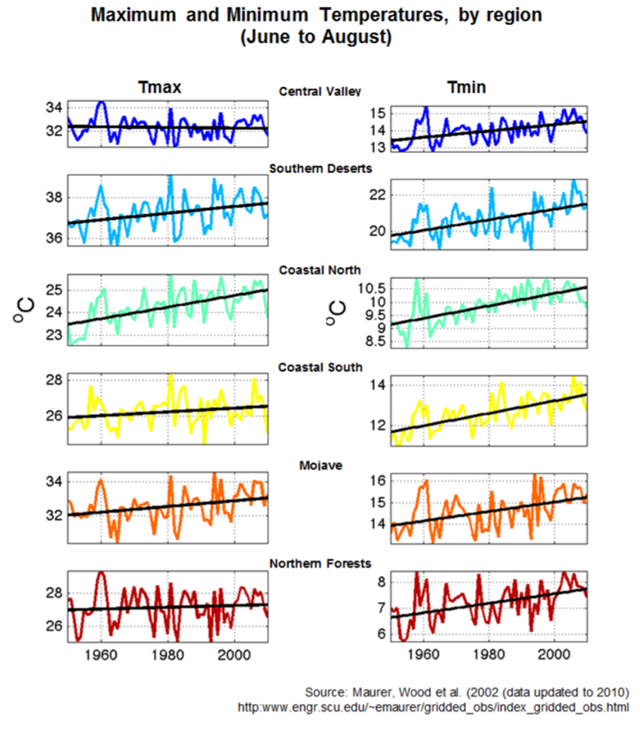
Graph of the Day: Maximum and minimum temperatures in California, by region, 1950-2010
8 August 2013 (CalEPA) – Summertime (June-August) maximum (Tmax) and minimum (Tmin) temperatures have increased between 1950 and 2010 for each of the six climate regions. The map of California climate regions is based on a space-time analysis of temperature extremes (see Richman and Lamb, 1985; Comrie and Glenn, 1998; Guirguis and Avissar, 2008 for methodology). Tmax reflects the hottest daytime temperatures, while Tmin reflects the coolest nighttime temperatures. Tmax increased for all regions except the Central Valley. The largest increase is observed for the Coastal North, which saw an increase of 0.26°C per decade, or 1.57°C over the 61-year record. The desert regions (Mojave and Southern Deserts) saw the second largest increase in Tmax with a 0.16°C increase (Southern Deserts) and a 0.17°C increase (Mojave) per decade, or 1°C over the 61-year period. Tmax increased in the Coastal South by 0.10°C per decade, or 0.64°C over the record. For the Northern Forests, Tmax increased by 0.05°C per decade or 0.32°C over the 61-year record. The Central Valley saw a slight decrease of 0.03°C per decade, or 0.17°C over the analysis period. Tmin increased for all regions, and this trend was generally larger than the trend in Tmax (except for the Coastal North, where the Tmax trend was larger). The largest increase in summertime minimum temperatures was seen in the southern parts of California. The Coastal South saw the biggest trend, with Tmin increasing by 0.31°C per decade, or 1.89°C over the record. The Southern Deserts saw the second largest increase in Tmin with an increase of 0.29°C over the decade, or 1.78°C over the 61- year period. The Coastal North observed the third largest increase of 0.24°C per decade, or 1.45°C over the record. The Mojave increased by 0.22°C per decade, or 1.33°C in all. The Central Valley and Northern Coasts increased by 0.18°C per decade or 1.1°C over the 61-year record.
