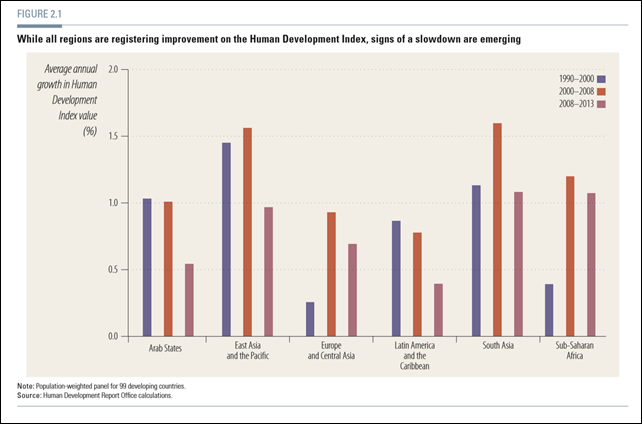
Graph of the Day: Average annual growth in the Human Development Index, 1990-2013
(UNDP) – Since 1990 the Human Development Index (HDI) has been an important measure of progress—a composite index of life expectancy, years of schooling and income. This year’s Report presents HDI values for 187 countries. The global HDI is now 0.702, and most developing countries are continuing to advance, though the pace of progress remains highly uneven (table 2.1). The lowest regional HDI values are for Sub- Saharan Africa (0.502) and South Asia (0.588), and the highest is for Latin America and the Caribbean (0.740), followed closely by Europe and Central Asia (0.738). The very high human development group—as measured by the HDI—has a value of 0.890, considerably higher than that of the medium and low human development groups. But lower human development groups continue to converge with the higher levels. While all regions are registering improvement, signs of a slowdown are emerging—as measured by the growth rate of HDI values (figure 2.1). Although four of the six regions registered faster gains in 2000–2008 than in the 1990s, progress in all regions slowed in 2008–2013. This was particularly noticeable in the Arab States and in Latin America and the Caribbean—where average annual growth dropped by about half—as well as in Asia. The global financial and economic crisis appears to have had a widespread impact. The deceleration is evident in all three components of the HDI. Growth in gross national income (GNI) per capita has declined, particularly in the Arab States and in Europe and Central Asia. Growth rates of life expectancy at birth have recently declined in most regions—especially in Asia—though they increased in Sub-Saharan Africa. And since 2008 the growth of expected years of schooling has also declined.
All four human development groups have experienced a slowdown in HDI growth (figure 2.2). In fact, the very high human development group had been progressing more slowly even before the global crisis. The low human development group, by contrast, accelerated in 2000–2008, but progress subsequently declined, due largely to a decline in the growth of years of schooling. Despite achievement in primary education—with gross enrolment ratios averaging 100 percent—it may be harder to move more pupils to the secondary level and beyond. In this group of countries 43 percent of children enrolled in primary education do not complete it, while gross enrolment ratios in secondary education average only 39 percent. The implication: The transition from primary to secondary and higher education is unacceptably low. Stronger investments are needed to prevent future vulnerabilities.

