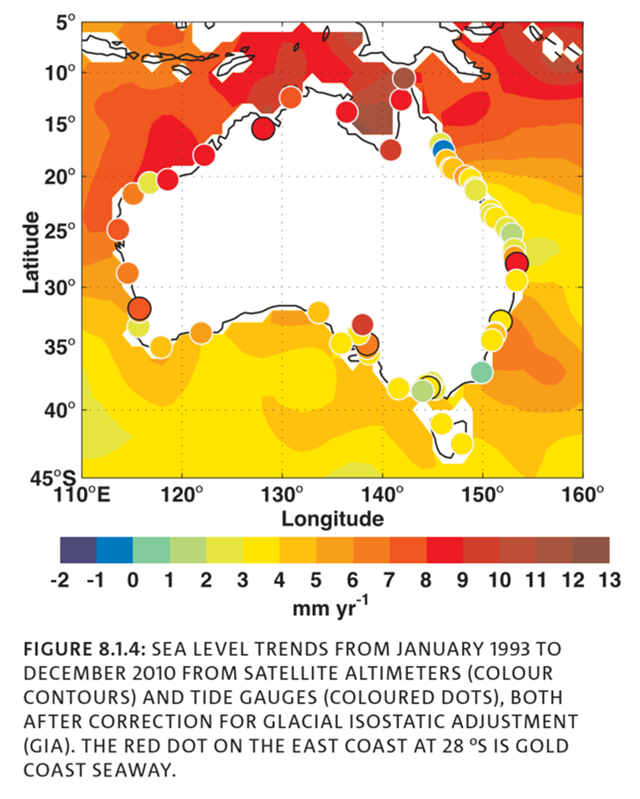
Graph of the Day: Australia sea level trends, 1993-2010
27 January 2015 (CSIRO) – The rates of sea level rise are not uniform around Australia. Over the period from 1993 when satellite altimeter data are available, the sea level trends are larger than the GMSL trend in northern Australia and similar to the GMSL trend in southern Australia (Figure 8.1.4; White, et al., 2014). The tide gauge and altimeter trends are generally similar, with several exceptions: the tide gauge rates at Hillary’s (northern Perth) and Adelaide are larger because of downward land motion; at the Gold Coast Seaway there is an instrumental issue; and the gauges at Eden and Bunbury have trends that are anomalous compared with nearby locations to the north and south that may be related to unresolved datum or vertical land motion issues. Off south-eastern Australia, the altimeter shows a larger trend offshore than the tide gauge trends. This is thought to be associated with a strengthening of the ocean circulation in the South Pacific Ocean and southward extension of the East Australian Current (Hill, et al., 2011, Deng, et al., 2010), resulting in lower trends at the coast compared with off shore. The larger rates in northern Australia are largely associated with interannual variability and these larger rates are not representative of a longer term trend (Zhang and Church, 2012, White, et al., 2014). The two longest Australian sea level records from Fort Denison Sydney and Fremantle extend back to the late 19th century. The Sydney record appears to contain some anomalous data between 1910 and 1940, with falling sea level near the start of the period and rapidly rising sea level near the end of this period (White et al. 2014). Over the full record from 1886 to 2010, the relative sea level trend at Sydney is 0.65 ± 0.05 mm yr-1, slightly less than the trend of 0.8 mm yr-1 over 1966 to 2010. When this latter period is corrected for GIA and atmospheric pressure changes, the trend is 1.3 mm yr-1, less than the global average trend over 1966 to 2009 of 2.0 mm yr-1. At Fremantle, the relative sea level trend over 1897 to 2010 is 1.6 ± 0.1 mm yr-1, with a trend of 2.2 mm yr-1 over 1920 to 1960, little trend from 1960 to 1990 and 4 mm yr-1 over the last two decades.
Climate Change in Australia: Projections for Australia’s NRM Regions
