The mass of human-made materials now equals the planet’s biomass – “Anthropogenic” mass is doubling every twenty years

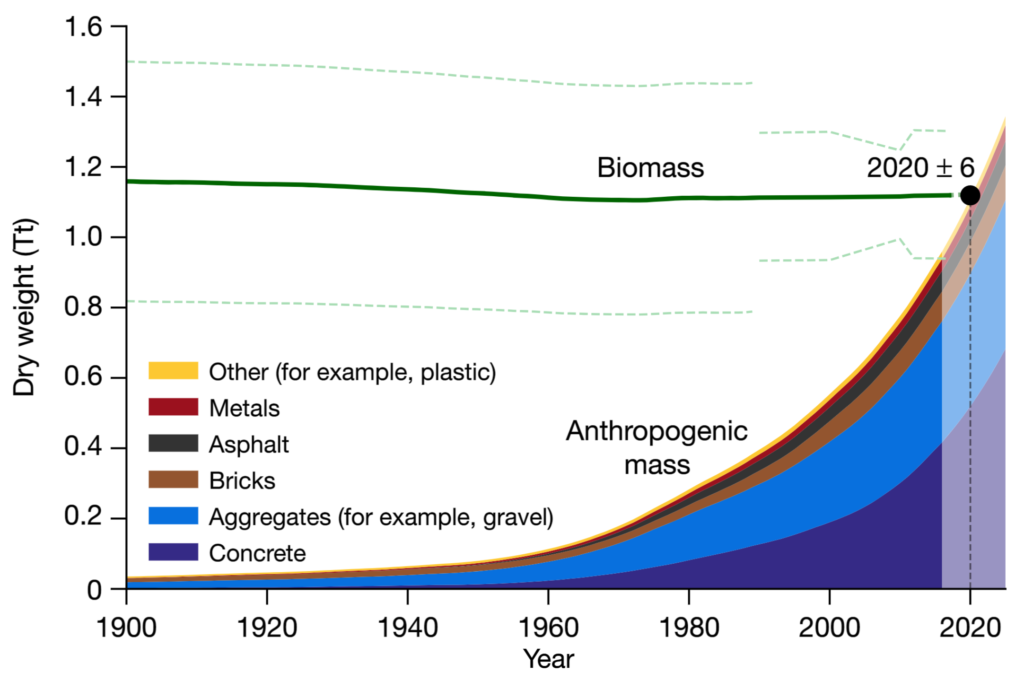
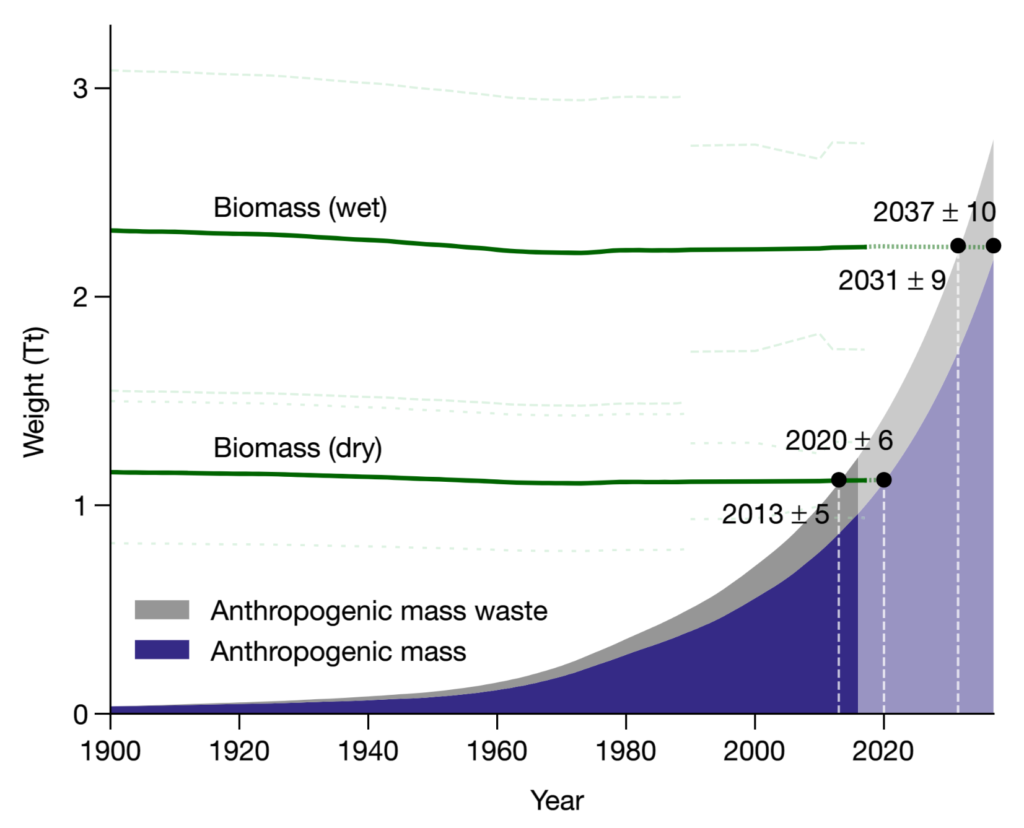
9 December 2020 (Weizmann Institute of Science) – Earth circa 2020: The mass of all human-produced materials – concrete, steel, asphalt, etc. – has grown to equal the mass of all life on the planet, its biomass. According to a new study at the Weizmann Institute of Science, we are right at this tipping point, and humans are currently adding new buildings, roads, vehicles and products at a rate that is doubling every 20 years, leading to a “concrete jungle” that is predicted to reach over two teratonnes (i.e. two million million) – or more than double the mass of living things, by 2040.
The study, published today [pdf] in Nature and conducted in the group of Prof. Ron Milo of the Plant and Environmental Sciences Department by Emily Elhacham and Liad Ben Uri, shows that at the outset of the 20th century, human-produced “anthropogenic mass” equaled just around 3% of the total biomass. How did we get from 3% to an equivalent mass in just over a century? Not only have we humans quadrupled our numbers in the intervening years, the things we produce have far outpaced population growth: Today, on average, for each person on the globe, a quantity of anthropogenic mass greater than their body weight is produced every week.
The upswing is seen markedly from the 1950s on, when building materials like concrete and aggregates became widely available. In the “great acceleration” following World War II, spacious single-family homes, roads and multi-story office buildings spang up around the US, Europe and other countries. That acceleration has been ongoing for over six decades, and those two materials, in particular, make up a major component of the growth in anthropogenic mass.
“The study provides a sort of ‘big picture’ snapshot of the planet in 2020. This overview can provide a crucial understanding of our major role in shaping the face of the Earth in the current age of the Anthropocene. The message to both the policy makers and the general public is that we cannot dismiss our role as a tiny one in comparison to the huge Earth. We are already a major player and I think with that comes a shared responsibility.” says Milo.
Referring to the dynamics of the human-made materials in our world as a “socio-economic metabolism,” the study invites further comparison with the way that natural materials flow through the planet’s living and geologic cycles. “By contrasting human-made mass and biomass over the last century, we bring into focus an additional dimension of the growing impact of human activity on our planet,” says Elhacham.
Milo: “This study demonstrates just how far our global footprint has expanded beyond our ‘shoe size.’ We hope that once we all have these somewhat shocking figures before our eyes, we can, as a species, behave more responsibly.”
Milo and Elhacham teamed with graphic designer Itai Raveh to create a website, Anthropomass.org, to help explain these figures in clear, simple terms.
The Mass of Human-Made Materials Now Equals the Planet’s Biomass

ABSTRACT: Humanity has become a dominant force in shaping the face of Earth1,2,3,4,5,6,7,8,9. An emerging question is how the overall material output of human activities compares to the overall natural biomass. Here we quantify the human-made mass, referred to as ‘anthropogenic mass’, and compare it to the overall living biomass on Earth, which currently equals approximately 1.1 teratonnes10,11. We find that Earth is exactly at the crossover point; in the year 2020 (± 6), the anthropogenic mass, which has recently doubled roughly every 20 years, will surpass all global living biomass. On average, for each person on the globe, anthropogenic mass equal to more than his or her bodyweight is produced every week. This quantification of the human enterprise gives a mass-based quantitative and symbolic characterization of the human-induced epoch of the Anthropocene.


2 Responses
Comments are closed.