March 25, 2009
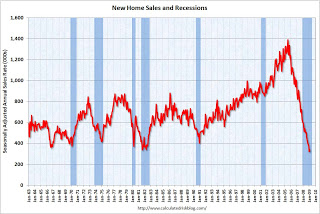
Graph of the Day: New Home Sales, 1963-2009
From Calculated Risk: 
The graph shows New Home Sales vs. recessions for the last 45 years. New home sales have fallen off a cliff.
Sales of new one-family houses in February 2009 were at a seasonally adjusted annual rate of 337,000, according to estimates released jointly today by the U.S. Census Bureau and the Department of Housing and Urban Development. This is 4.7 percent (±18.3%) above the revised January rate of 322,000, but is 41.1 percent (±7.9%) below the February 2008 estimate of 572,000. …

New Home Sales: Just above Record Low
Technorati Tags: financial collapse