August 2, 2009
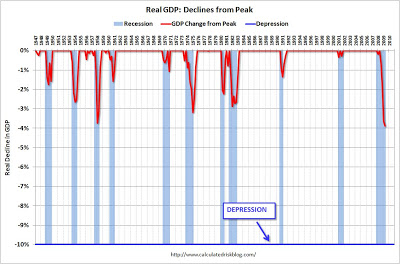
Graph of the Day: Real Declines in GDP, 1947-2009
From Calculated Risk: 
An update: the graph shows the decline in real GDP (quarterly) from the previous peak since 1947. GDP is now 3.9% below the recent peak. In terms of declines in real GDP, the current recession is the worst since quarterly records have been kept (starting in 1947). Note: This includes the downward revisions to the previous quarters. When the red line is at zero it indicates that that quarter is at an all time high in terms of real GDP. It will be interesting to see how long it takes for real GDP to reach the pre-recession peak. With a a sluggish recovery, and assuming no more cliff diving, it could take until sometime in 2011.
Technorati Tags: financial collapse