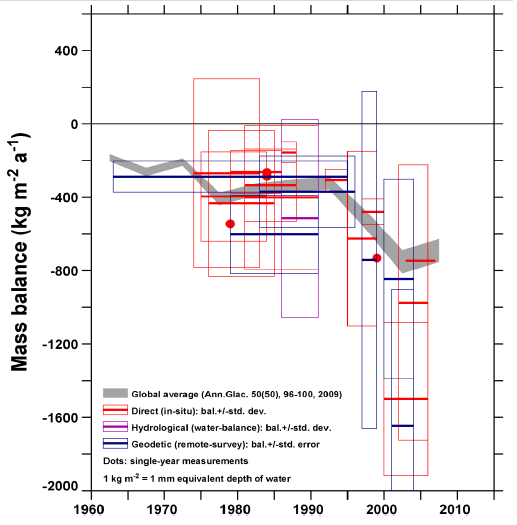
Graph of the Day: All Published Himalaya Glacier Mass Balance Measurements, 1960s – 2000s
The graph shows all published Himalaya-Karakoram (HK) measurements; they are more negative after 1995 than before. The map shows where the measurement sites are. Mass balance varies greatly year to year; these are series averages. Boxes suggest estimated uncertainty. The apparent trend is less uncertain than any one measurement. The data indicate either accelerating loss or stepwise increase in mass loss rate. This need not be true of every part of the region. For example there are suggestions of recent mass gain in the Karakoram. Mass loss rate here is consistent with the global average. The mass-balance rate required to remove all H-K ice during 2000-2035 would be about -11,000 kg m-2a-1. The oft-quoted 2035 disappearance date of Himalayan glaciers is not accurate (see slides 39-41). Negative mass balance is loss of a non-renewable water resource. We can only get it back from the ocean by desalination. In the meantime, it will raise the level of the sea, and the glaciers themselves (and thawed mountain slopes) in some cases become more hazardous as they shed mass. The data are insufficient to make strong intraregional comparisons, and so inferences about regional transitions of behavior are drawn from other types of information, such as the pattern of glacier breakup into lakes and other morphological indicators of behavior.
Kargel, et al., Satellite-era glacier changes in High Asia [pdf], Background support presentation for NASA “Black Carbon and Aerosols” press conference, associated with Fall AGU, Dec. 14, 2009
