We used satellite imagery and AI to see who’s keeping their climate pledges – Almost none of the signatories of the Global Methane Pledge are following through on their commitment – On average, companies emit methane intensities 16 times larger than reported
By Antoine Rostand
17 July 2024
(Fortune) – Committing countries or companies to climate pledges doesn’t guarantee that those pledges will be honored. After all, the planet is getting a great deal hotter every year, with the record-breaking temperature in India in May just the latest example. If companies and countries were fully honoring their commitments, it’s highly likely that the rate of global warming would be slowing. And one reason why companies and countries are not honoring their pledges is a simple lack of transparency.
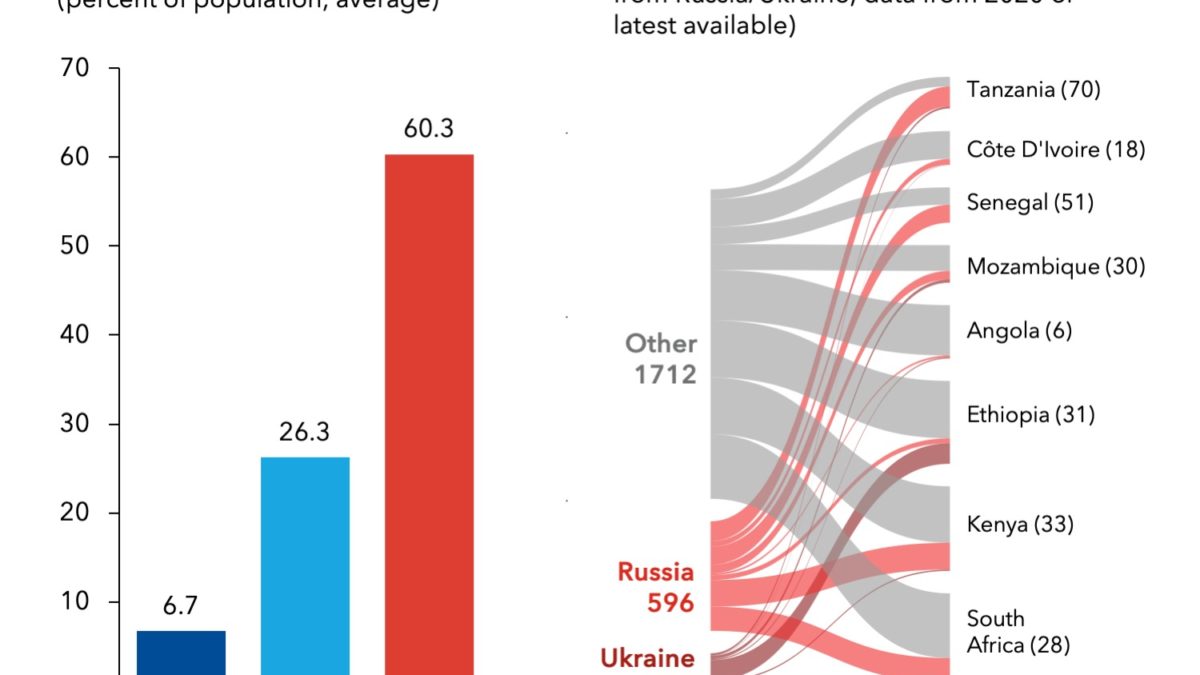
This is where technology comes in. We now have at our disposal tools that allow us to see, with pinpoint precision and in close to real-time, exactly what is going on with regard to the climate and where. We can see, for instance, that the average difference between what the 42 biggest oil and gas producers say they emit, and what they actually emit, is vast.
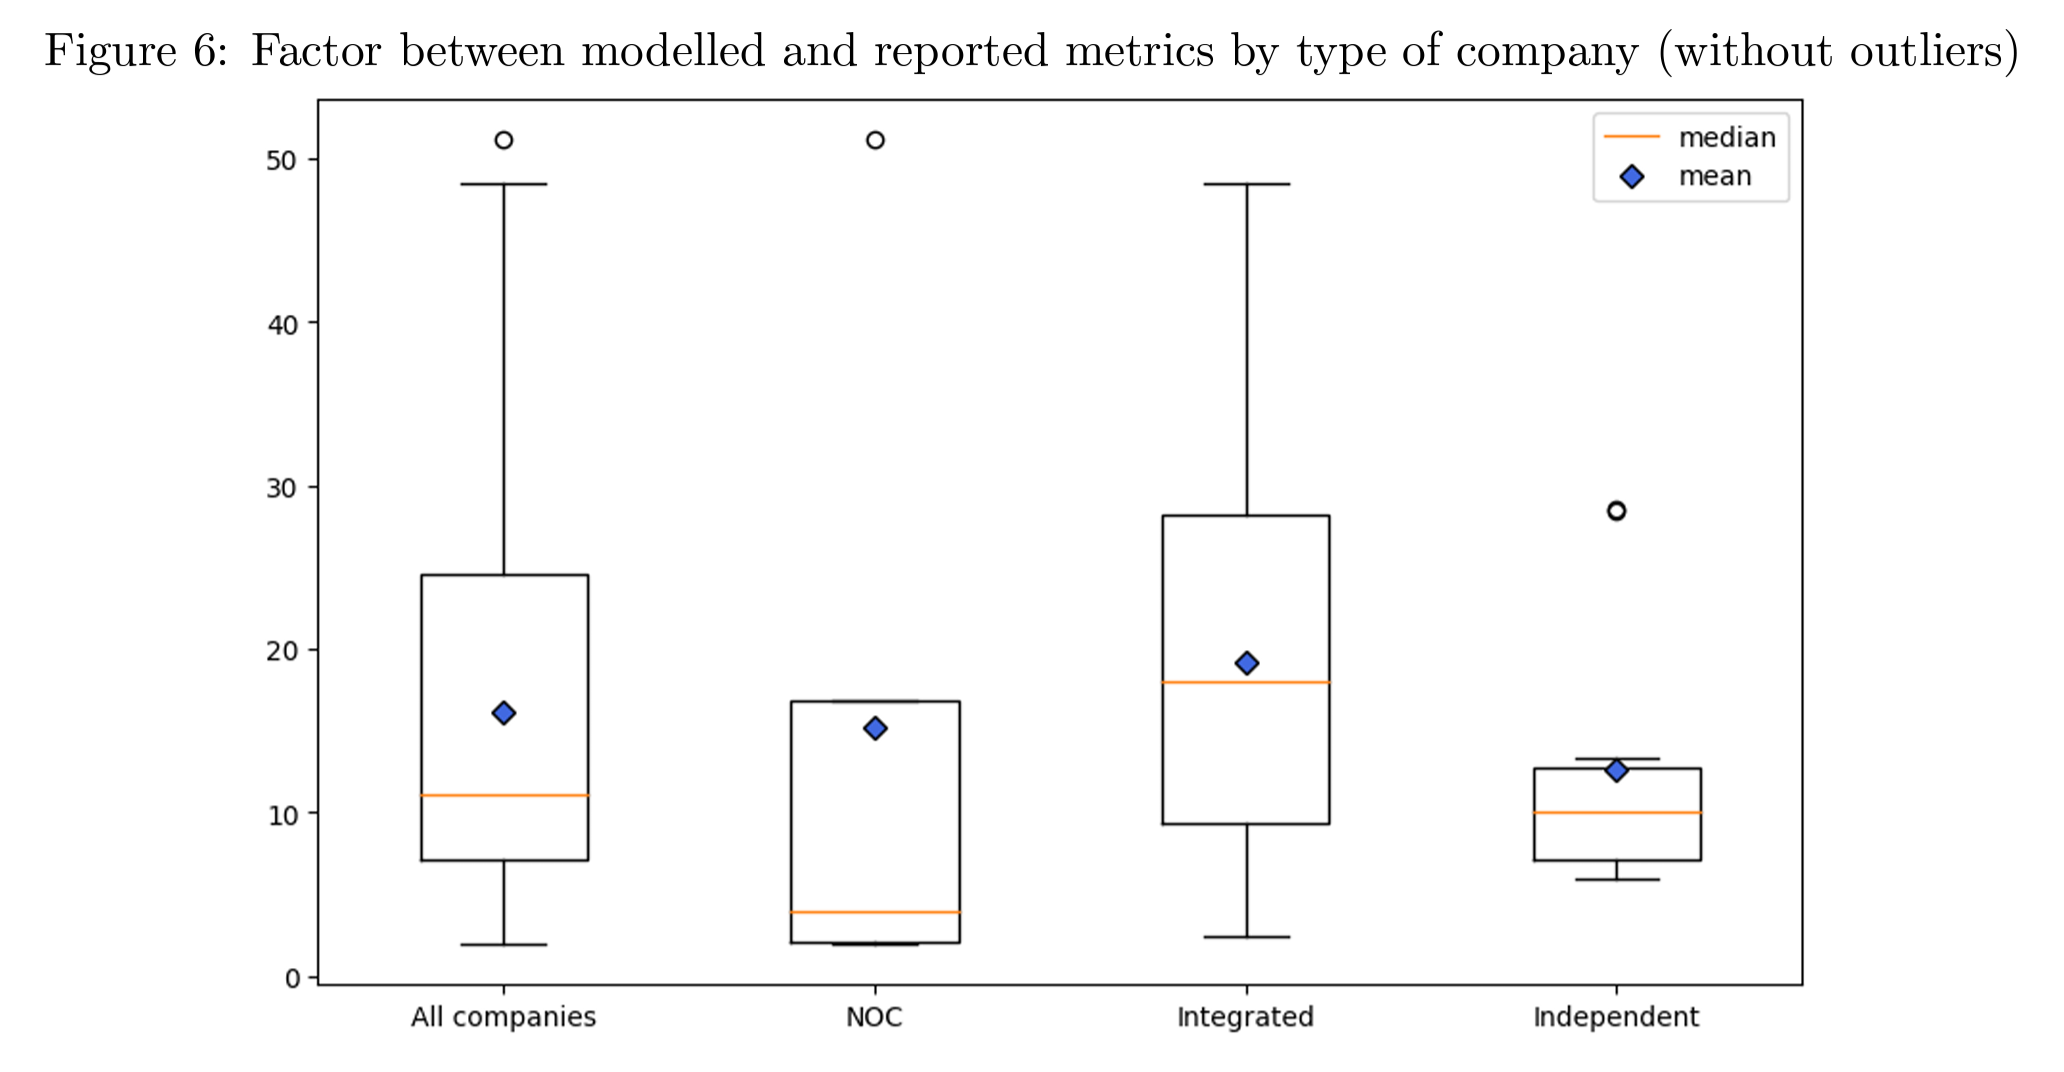
We calculated this at Kayrros by modeling the methane intensities of upstream oil and gas activities, assuming a diverse range of territories where production took place and a variety of production volumes. We brought together data drawn from satellites and processed by artificial intelligence (AI), as well as public estimates of methane emissions, country-level oil and gas production data, and self-reporting by companies. On average, our model shows 16.1 times larger methane intensities than those reported by companies. This is largely down to the fact that regional production profiles differ greatly and can have a significant impact on the value of modeled methane intensities.
But that isn’t all that we can see thanks to advances in Earth observation technology. We can see that (despite massive skepticism) the overwhelming majority of forest conservation and restoration projects tied to the voluntary carbon market do perform their function, and therefore could—and should—be seen as a viable and effective means of directing money from the big polluters in the Global North to the stewards of our forestry endowment in the Global South. In June last year, we used our Forest Carbon Monitor to assess more than 90% of the Amazon, which is the world’s largest rainforest and one of the world’s largest carbon sinks. Our analysis, which we ran by processing terabytes of satellite data with AI, showed that of 75 reviewed conservation and emissions-reduction projects funded by the carbon market, just five showed the same static deforestation rates. In other words, 96% were working. More recent analyses—considered 115 REDD+ projects (98 of which are active), spread across the Amazon and Africa—yielded similar findings. In short, Earth observation technology now ensures that the world can see who is meeting their commitments and who is falling short.
That same technology has revealed something disquieting: Almost none of the signatories of the Global Methane Pledge are following through on their commitment. That commitment was to collectively reduce methane emissions by 30% from 2020 levels by 2030, and it was rooted in the robust scientific fact that in its first 20 years in the atmosphere, methane is 84 times as potent as carbon dioxide. Fulfilling the GMP could therefore eliminate over 0.2˚C of warming by 2050. That countries aren’t following through on promises like these suggests that their leaders see them as contingent on circumstances, which undermines both past and future climate commitments, suggesting that they are, in fact, optional.
Climate action must stand above and beyond political and ideological disputes, which ultimately depend on there being a secure societal context in which to have them. If the planet keeps getting hotter, and national and corporate promises keep falling by the wayside, those societies will begin to feel very insecure indeed. We have the technology to inform legislation and regulation, to make sure climate action is as targeted, unintrusive, and cost-effective as possible. COP is now fewer than five months away. Commitments must be firm and enduring, able to be maintained regardless of whatever else is going on—because something else will always be going on.
Modeling Methane Intensity of Oil and Gas Upstream Activities by Production Profile
ABSTRACT: We propose a methodology for modelling methane intensities of Oil and Gas upstream activities for different production profiles with diverse combinations of region of operation and production volumes associated. This methodology leverages different data sources, including satellite measurements and public estimates of methane emissions but also country-level oil and gas production data and company reporting. The obtained methane intensity models are compared to the reference companies’ own reporting in order to better understand methane emissions for different types of companies. The results show that regions of operation within the different production profiles have a significant impact on the value of modelled methane intensities, especially for operators located in a single or few countries, such as national and medium-sized international operators. This paper also shows that methane intensities reported by the companies tend to be on average 16.1 times smaller than that obtained using the methodology presented here, and cannot account for total methane emissions that are estimated for upstream operations in the different regions observed.
Modeling Methane Intensity of Oil and Gas Upstream Activities by Production Profile