Exxon disputed climate findings for years. Its scientists knew better. “ExxonMobil scientists knew about this problem to a shockingly fine degree as far back as the 1980s, but company spokesmen denied, challenged, and obscured this science.”

By Alice McCarthy
12 January 2023
(The Harvard Gazette) – Projections created internally by ExxonMobil starting in the late 1970s on the impact of fossil fuels on climate change were very accurate, even surpassing those of some academic and governmental scientists, according to an analysis published Thursday in Science by a team of Harvard-led researchers. Despite those forecasts, team leaders say, the multinational energy giant continued to sow doubt about the gathering crisis.
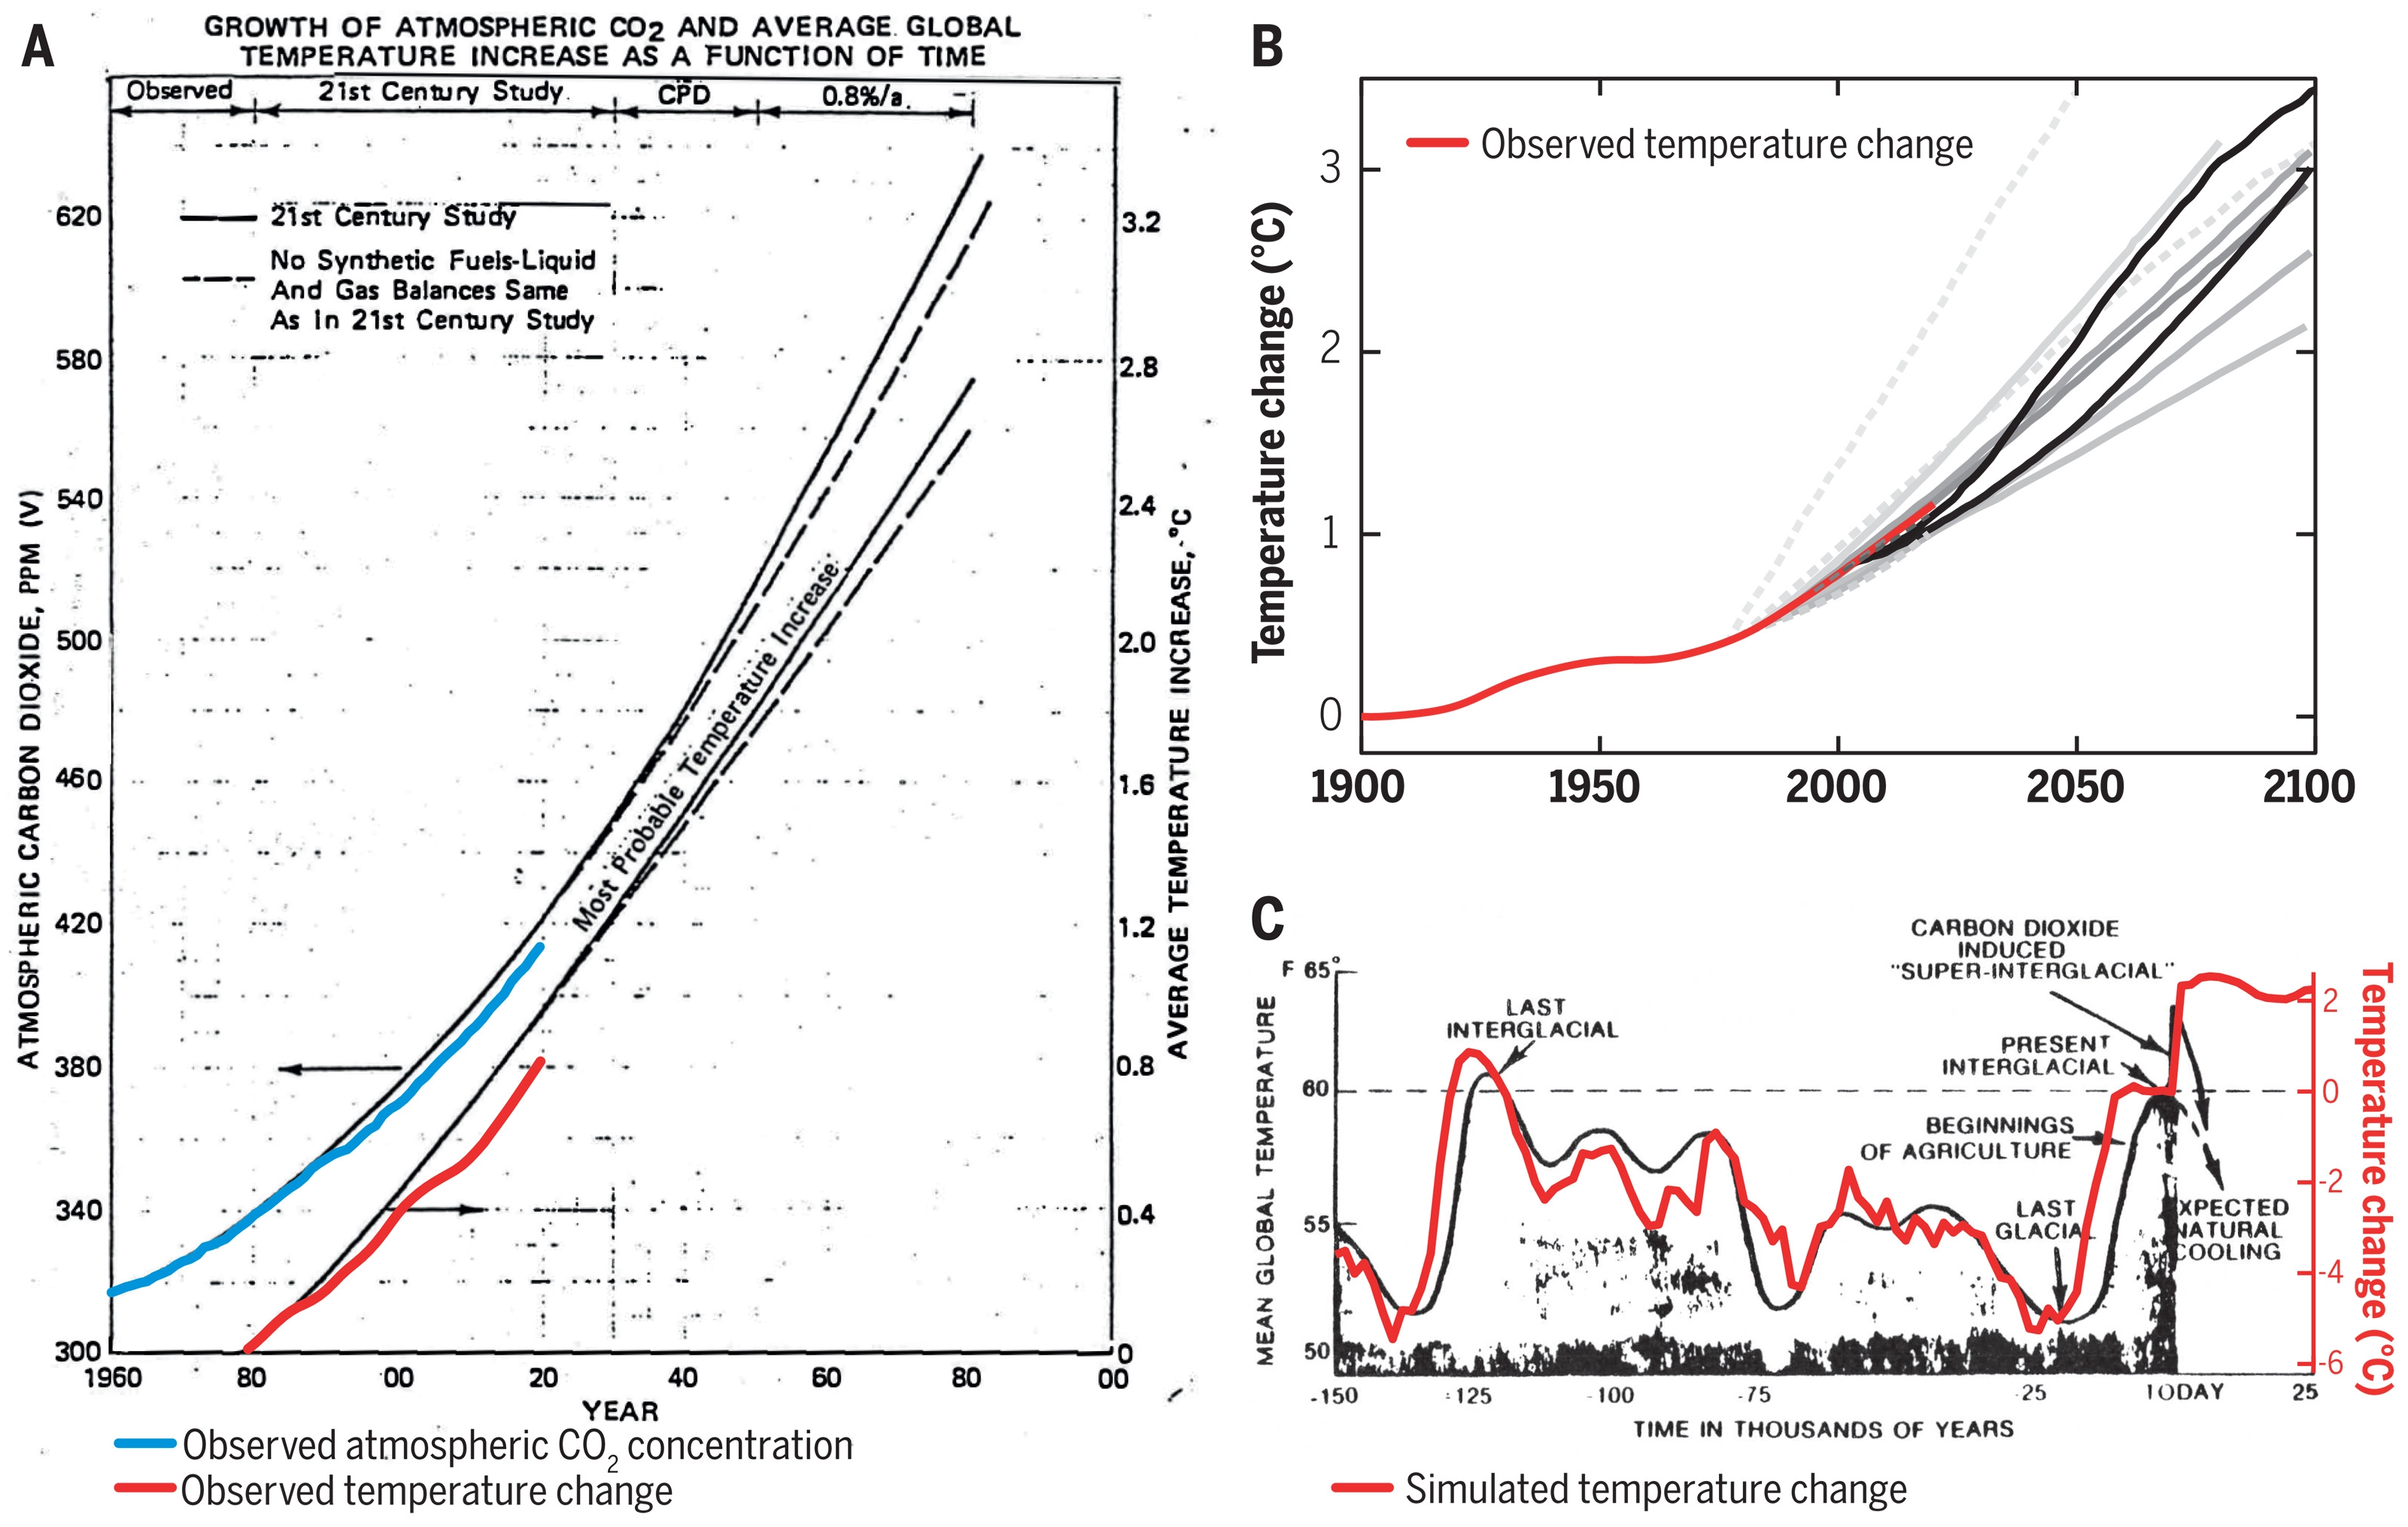
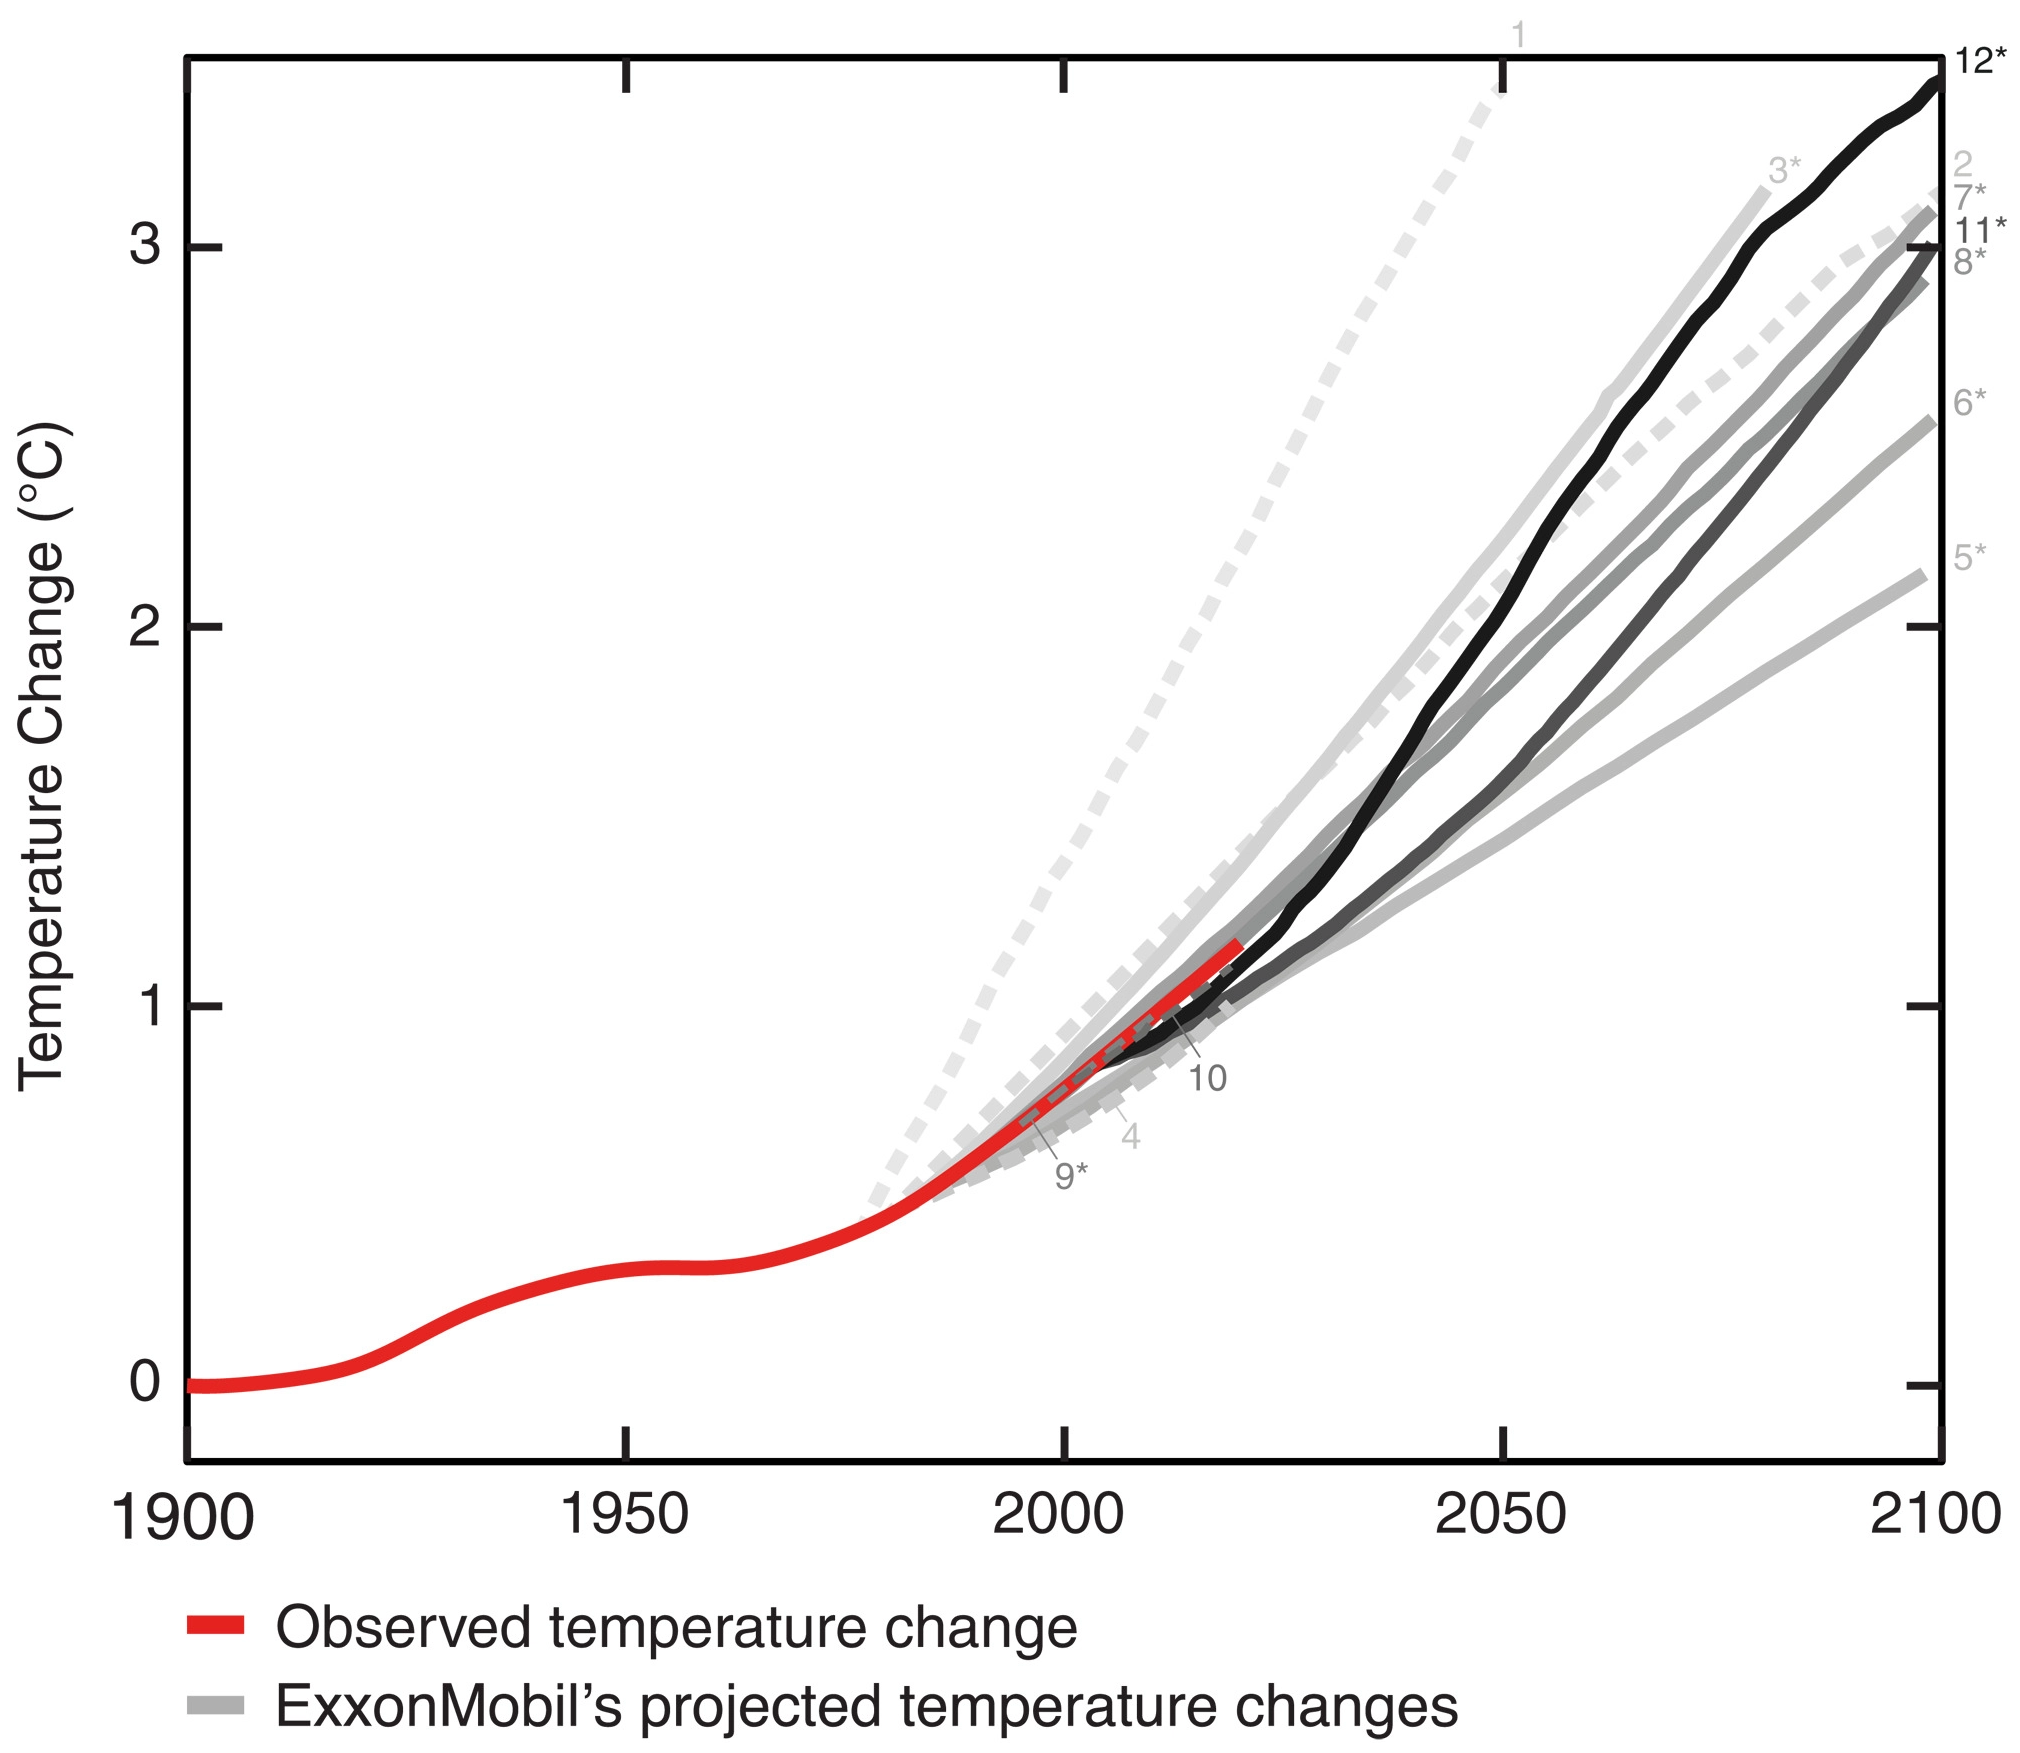
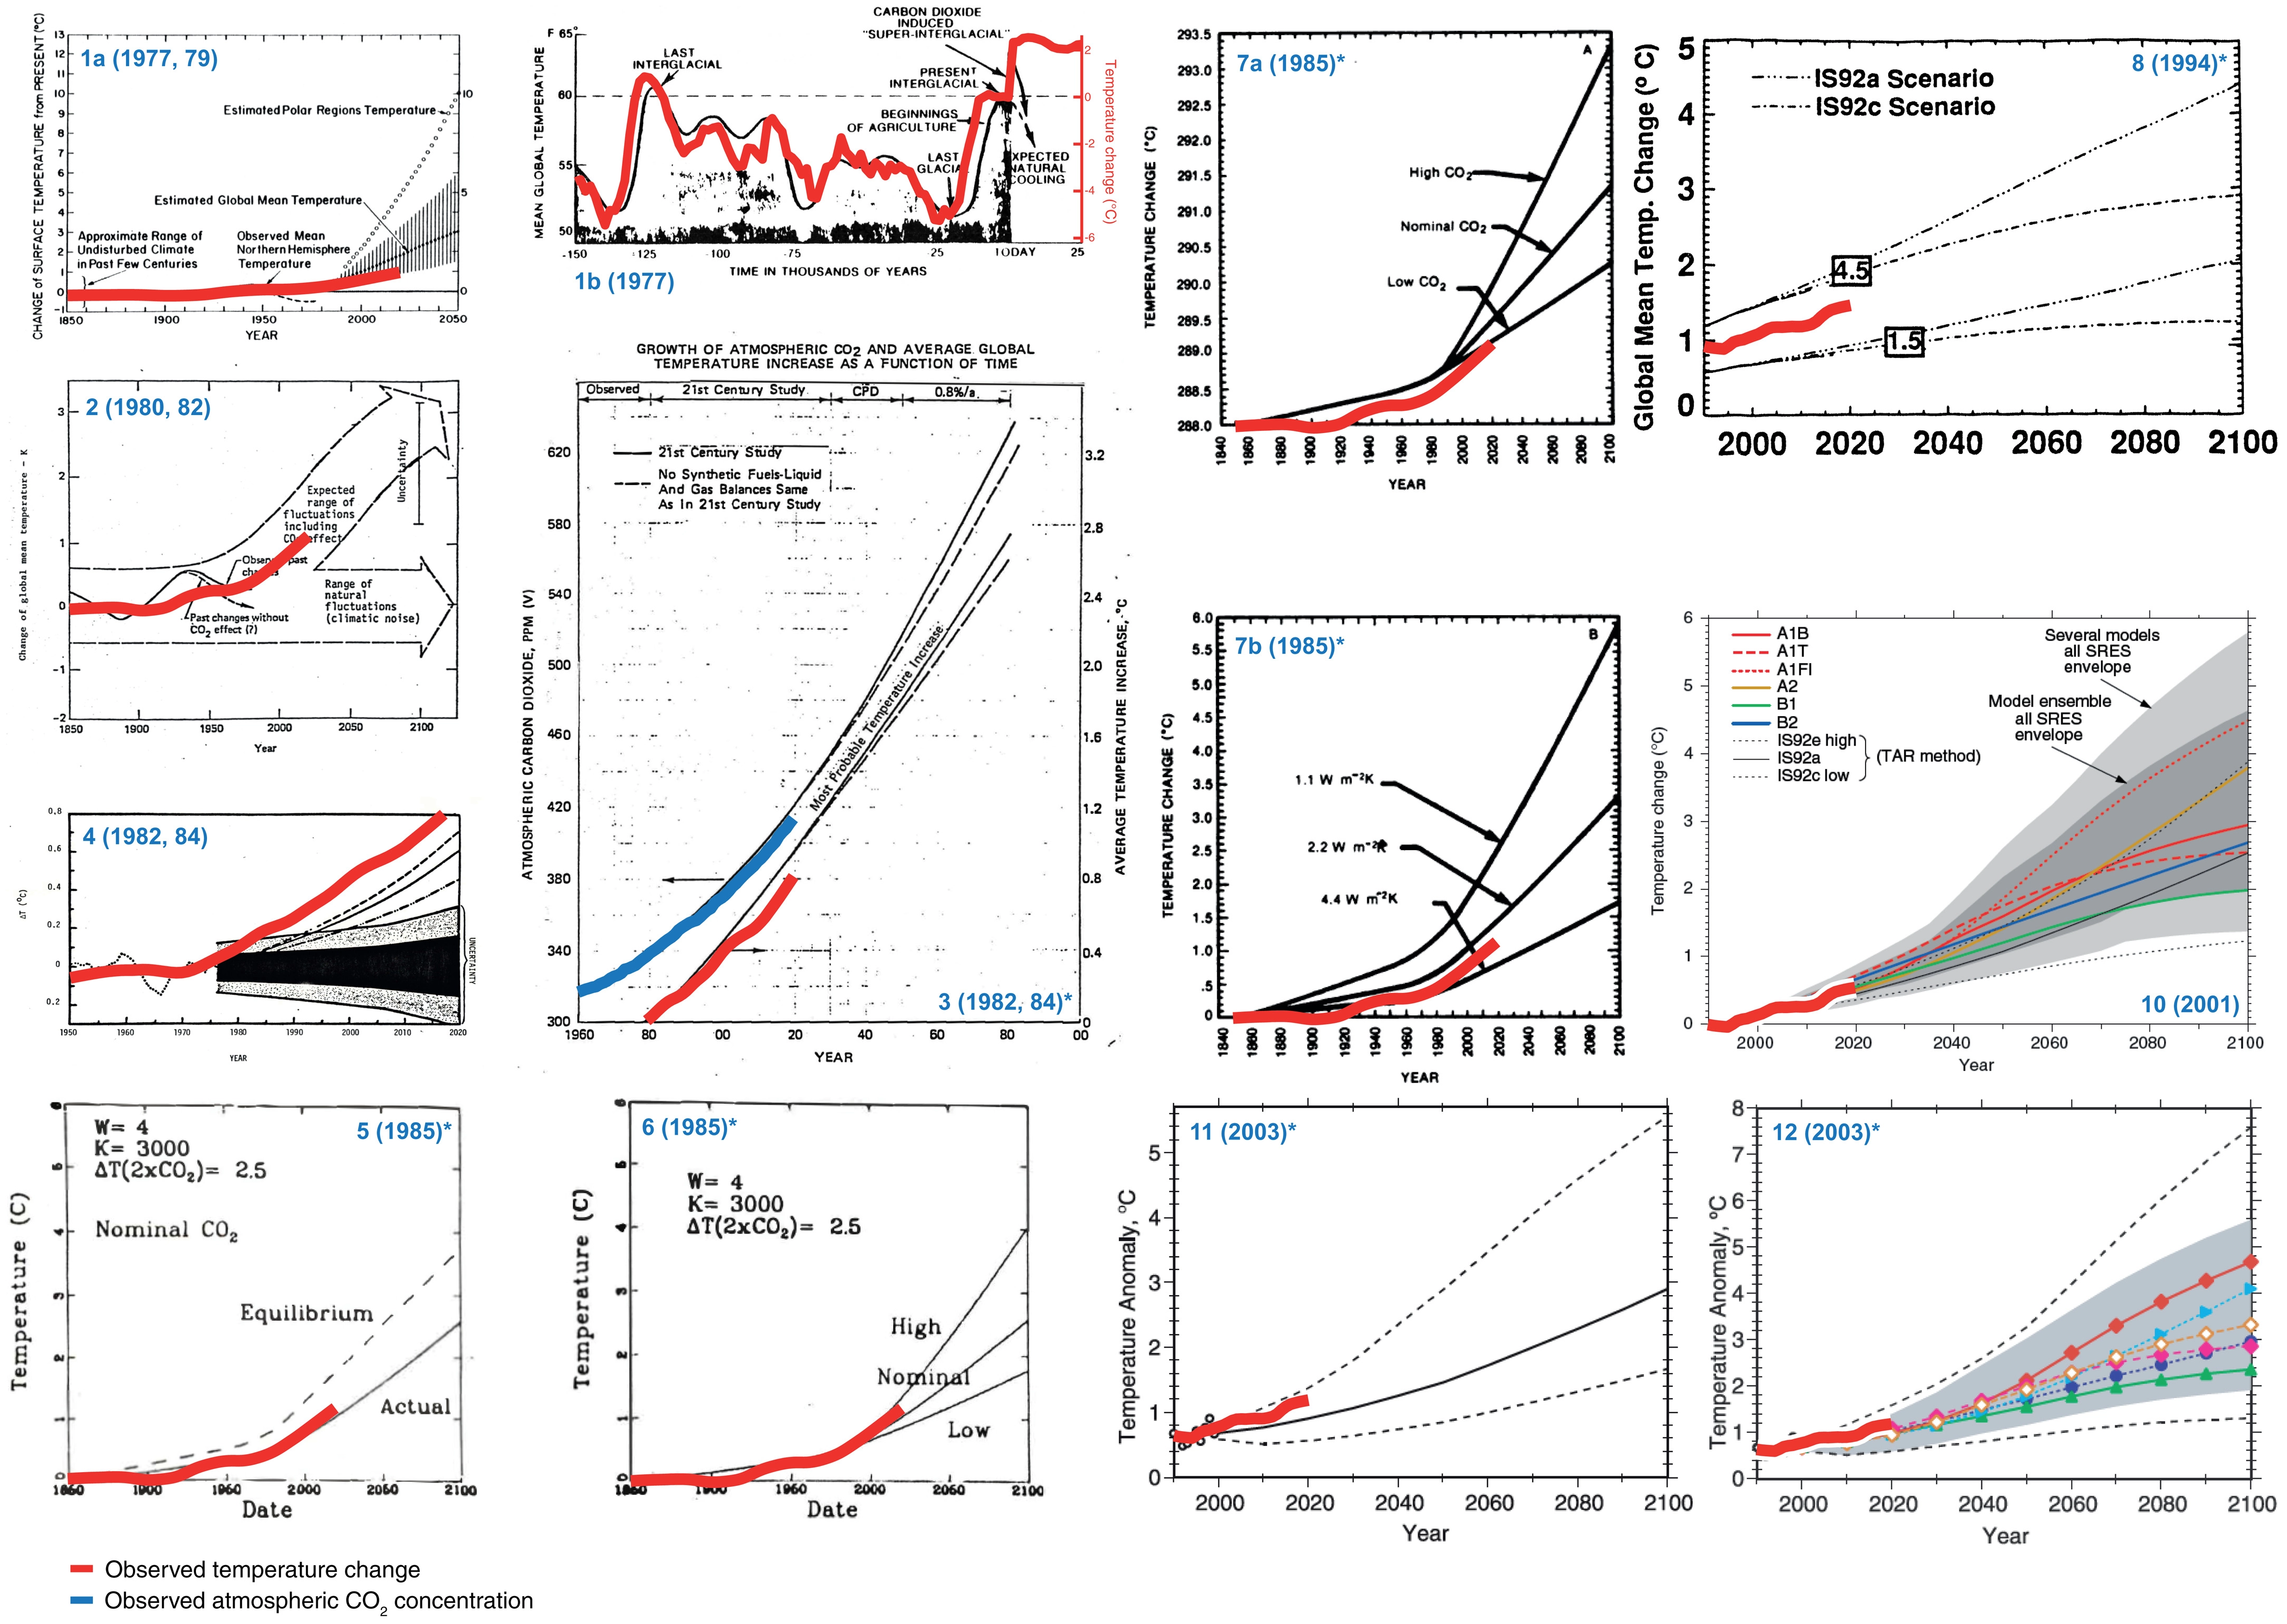
In “Assessing ExxonMobil’s Global Warming Projections,” researchers from Harvard and the Potsdam Institute for Climate Impact Research show for the first time the accuracy of previously unreported forecasts created by company scientists from 1977 through 2003. The Harvard team discovered that Exxon researchers created a series of remarkably reliable models and analyses projecting global warming from carbon dioxide emissions over the coming decades. Specifically, Exxon projected that fossil fuel emissions would lead to 0.20 degrees Celsius of global warming per decade, with a margin of error of 0.04 degrees — a trend that has been proven largely accurate.
“This paper is the first ever systematic assessment of a fossil fuel company’s climate projections, the first time we’ve been able to put a number on what they knew,” said Geoffrey Supran, lead author and former research fellow in the History of Science at Harvard. “What we found is that between 1977 and 2003, excellent scientists within Exxon modeled and predicted global warming with, frankly, shocking skill and accuracy only for the company to then spend the next couple of decades denying that very climate science.”
“We thought this was a unique opportunity to understand what Exxon knew about this issue and what level of scientific understanding they had at the time,” added co-author Naomi Oreskes, Henry Charles Lea Professor of the History of Science whose work looks at the causes and effects of climate change denial. “We found that not only were their forecasts extremely skillful, but they were also often more skillful than forecasts made by independent academic and government scientists at the exact same time.”

Allegations that oil company executives sought to mislead the public about the industry’s role in climate change have drawn increasing scrutiny in recent years, including lawsuits by several states and cities and a recent high profile U.S. House committee investigation.
Harvard’s scientists used established Intergovernmental Panel on Climate Change (IPCC) statistical techniques to test the performance of Exxon’s models. They found that, depending on the metric used, 63-83 percent of the global warming projections reported by Exxon scientists were consistent with actual temperatures over time. Moreover, the corporation’s own projections had an average “skill score” of 72 percent, plus or minus 6 percent, with the highest scoring 99 percent. A skill score relates to how well a forecast compares to what happens in real life. For comparison, NASA scientist James Hansen’s global warming predictions presented to the U.S. Congress in 1988 had scores from 38 to 66 percent.
The researchers report that Exxon scientists correctly dismissed the possibility of a coming ice age, accurately predicted that human-caused global warming would first be detectable in the year 2000, plus or minus five years, and reasonably estimated how much CO2 would lead to dangerous warming.
In summary, climate projections reported by ExxonMobil scientists between 1977 and 2003 were accurate and skillful in predicting subsequent global warming. Some projections suggested slightly too much warming and others not quite enough, but most (63 to 83%, depending on the metric used) were statistically consistent with subsequently observed temperatures, particularly after accounting for discrepancies between projected and observed changes in atmospheric CO2 concentrations. ExxonMobil’s projections were also consistent with, and as skillful as, those of academic and government scientists. All told, ExxonMobil was aware of contemporary climate science, contributed to that science, and predicted future global warming correctly. These findings corroborate and add quantitative precision to assertions by scholars, journalists, lawyers, politicians, and others that ExxonMobil accurately foresaw the threat of human-caused global warming, both prior and parallel to orchestrating lobbying and propaganda campaigns to delay climate action (1, 2, 10, 11, 13, 43–48), and refute claims by ExxonMobil Corp and its defenders that these assertions are incorrect (49).
Supran, et al., 2023 / Science
The current debate about when Exxon knew about the impact on climate change carbon emissions began in 2015 following news reports of internal company documents describing the multinational’s early knowledge of climate science. Exxon disagreed with the reports, even providing a link to internal studies and memos from their own scientists and suggesting that interested parties should read them and make up their own minds.
“That’s exactly what we did,” said Supran, who is now at the University of Miami. Together, he and Oreskes spent a year researching those documents and in 2017 published a series of three papers analyzing Exxon’s 40-year history of climate communications. They were able to show there was a systematic discrepancy between what Exxon was saying internally and in academic circles versus what they were telling the public. “That led us to conclude that they had quantifiably misled the public, by essentially contributing quietly to climate science and yet loudly promoting doubt about that science,” said Supran.
In 2021, the team published a new study in One Earth using algorithmic techniques to identify ways in which ExxonMobil used increasingly subtle but systematic language to shape the way the public talks and thinks about climate change — often in misleading ways. […]
“I think this new study is the smoking gun, the proof, because it shows the degree of understanding … this really deep, really sophisticated, really skillful understanding that was obscured by what came next,” Oreskes said. “It proves a point I’ve argued for years that ExxonMobil scientists knew about this problem to a shockingly fine degree as far back as the 1980s, but company spokesmen denied, challenged, and obscured this science, starting in the late 1980s/early 1990s.” [more]
Exxon disputed climate findings for years. Its scientists knew better.

Assessing ExxonMobil’s global warming projections
ABSTRACT: Climate projections by the fossil fuel industry have never been assessed. On the basis of company records, we quantitatively evaluated all available global warming projections documented by—and in many cases modeled by—Exxon and ExxonMobil Corp scientists between 1977 and 2003. We find that most of their projections accurately forecast warming that is consistent with subsequent observations. Their projections were also consistent with, and at least as skillful as, those of independent academic and government models. Exxon and ExxonMobil Corp also correctly rejected the prospect of a coming ice age, accurately predicted when human-caused global warming would first be detected, and reasonably estimated the “carbon budget” for holding warming below 2°C. On each of these points, however, the company’s public statements about climate science contradicted its own scientific data.


