Water cycle speeding up over much of U.S. – “As the planet warms, we anticipate that the warmer air, which holds more moisture, will lead to more evaporation and precipitation”
By Kasha Patel
26 July 2019
(NASA) – Water is everywhere on Earth, and it is a unique molecule that is critical for life. Where, when, and how it moves—the water cycle—is equally critical.
Water falls over Earth’s surface as rain, snow, or ice. From there, it evaporates and returns to the atmosphere; seeps into the ground as soil moisture or groundwater; or runs off into rivers or streams. It continually evaporates from bodies of water, gets transpired from vegetation, sublimes from ice and snow, condenses, and precipitates along these pathways.
In new research, scientists from the U.S. Geological Survey (USGS) showed that there has been an increase in the flow between the various stages of the water cycle over most the U.S. in the past seven decades. The rates of ocean evaporation, terrestrial evapotranspiration, and precipitation have been increasing. In other words, water has been moving more quickly and intensely through the various stages.
“As the planet warms we anticipate that the warmer air, which holds more moisture, will lead to more evaporation and precipitation,” said Tom Huntington, the study’s first author and a research hydrologist at USGS. “If those processes are increasing, it is evidence for an intensifying water cycle. But no one had really shown that trend quantitively.” Until now.
Huntington and colleagues developed a new method for calculating water cycle intensity, specifically looking at stages that occur over and on land. They took the sum of precipitation and evapotranspiration per year to serve as a new indicator of water cycle intensity. Precipitation data came from the PRISM Climate Group, which combined ground observations with sophisticated modeling to create continuous precipitation measurements across the U.S. Evapotranspiration data—the amount of water evaporating from the leaves of plants and from the land surface—was calculated using precipitation and temperature data and a water-balance model.
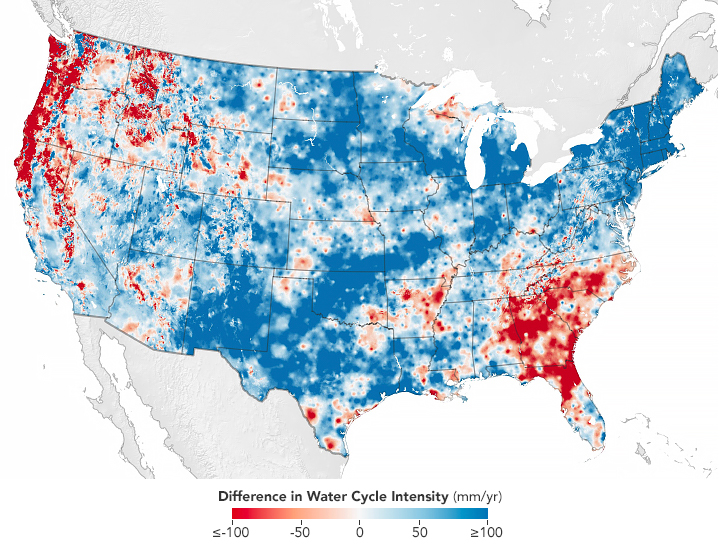
The map above shows where the water cycle has been intensifying or weakening across the continental U.S. from 1945-1974 to 1985-2014. Areas in blue show where the water cycle has been speeding up—moving through the various stages faster or with more volume. Red areas have seen declines in precipitation and evapotranspiration and experienced less intense or slower cycles. Larger intensity values indicate more water was cycling in that region, primarily due to increased precipitation.
The team also related their measurement of water cycle intensity to how much moisture is stored in the soil. They found the amount of water being stored in the soil during June through August is declining in parts of the southeast, northwest, and upper midwestern U.S.
“We’re trying to separate the precipitation totals into what comes out as streamflow, what goes up through evaporation, and what is stored in the soil,” said Huntington. The team found evapotranspiration had decreased in the southeast over the same time period, most likely because of decreased precipitation in those regions.
Huntington said these regions with weakening water cycles and low soil moisture should be carefully tracked over the next few decades because they could become increasingly dry. That would make agriculture more difficult or require more irrigation. On the other hand, too much rain or soil moisture storage, such as in the northeast U.S. or Texas, could lead to increased flooding.
Water Cycle is Speeding Up Over Much of the U.S.
A new indicator framework for quantifying the intensity of the terrestrial water cycle
ABSTRACT: A quantitative framework for characterizing the intensity of the water cycle over land is presented, and illustrated using a spatially distributed water-balance model of the conterminous United States (CONUS). We approach water cycle intensity (WCI) from a landscape perspective; WCI is defined as the sum of precipitation (P) and actual evapotranspiration (AET) over a spatially explicit landscape unit of interest, averaged over a specified time period (step) of interest. The time step may be of any length for which data or simulation results are available (e.g., sub-daily to multi-decadal). We define the storage-adjusted runoff (Q′) as the sum of actual runoff (Q) and the rate of change in soil moisture storage (ΔS/Δt, positive or negative) during the time step of interest. The Q′ indicator is demonstrated to be mathematically complementary to WCI, in a manner that allows graphical interpretation of their relationship. For the purposes of this study, the indicators were demonstrated using long-term, spatially distributed model simulations with an annual time step. WCI was found to increase over most of the CONUS between the 1945 to 1974 and 1985 to 2014 periods, driven primarily by increases in P. In portions of the western and southeastern CONUS, Q′ decreased because of decreases in Q and soil moisture storage. Analysis of WCI and Q′ at temporal scales ranging from sub-daily to multi-decadal could improve understanding of the wide spectrum of hydrologic responses that have been attributed to water cycle intensification, as well as trends in those responses.
A new indicator framework for quantifying the intensity of the terrestrial water cycle