Melting of Himalaya glaciers has doubled in recent years
By Kevin Krajick
19 June 2019
(Columbia University) – A newly comprehensive study shows that melting of Himalayan glaciers caused by rising temperatures has accelerated dramatically since the start of the 21st century. The analysis, spanning 40 years of satellite observations across India, China, Nepal and Bhutan, indicates that glaciers have been losing the equivalent of more than a vertical foot and half of ice each year since 2000 — double the amount of melting that took place from 1975 to 2000. The study is the latest and perhaps most convincing indication that climate change is eating the Himalayas’ glaciers, potentially threatening water supplies for hundreds of millions of people downstream across much of Asia.
“This is the clearest picture yet of how fast Himalayan glaciers are melting over this time interval, and why,” said lead author Joshua Maurer, a Ph.D. candidate at Columbia University’s Lamont-Doherty Earth Observatory. While not specifically calculated in the study, the glaciers may have lost as much as a quarter of their enormous mass over the last four decades, said Maurer. The study appears this week in the journal Science Advances.
Currently harboring some 600 billion tons of ice, the Himalayas are sometimes called the earth’s “Third Pole.” Many other recent studies have suggested that the glaciers are wasting, including one this year projecting that up to two-thirds of the current ice cover could be gone by 2100. But up to now, observations have been somewhat fragmented, zeroing in on shorter time periods, or only individual glaciers or certain regions. These studies have produced sometimes contradictory results, both regarding the degree of ice loss and the causes. The new study synthesizes data from across the region, stretching from early satellite observations to the present. The synthesis indicates that the melting is consistent in time and space, and that rising temperatures are to blame. Temperatures vary from place to place, but from 2000 to 2016 they have averaged 1 degree Centigrade (1.8 degrees Fahrenheit) higher than those from 1975 to 2000.
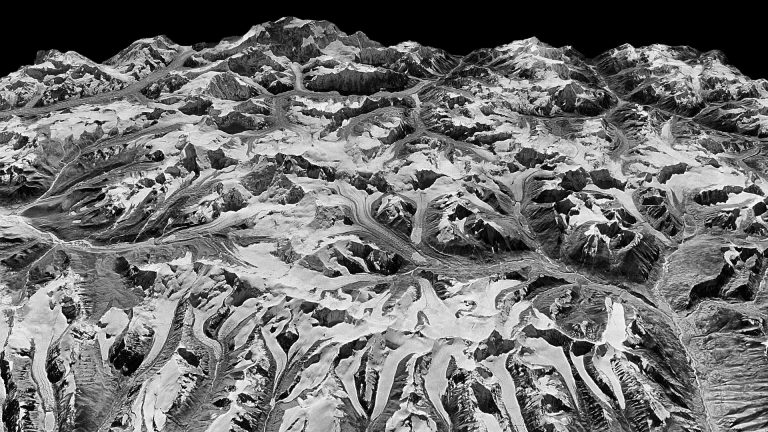
Maurer and his colleagues analyzed repeat satellite images of some 650 glaciers spanning 2,000 kilometers from west to east. Many of the 20th-century observations came from recently declassified photographic images taken by U.S. spy satellites. The researchers created an automated system to turn these into 3D models that could show the changing elevations of glaciers over time. They then compared these images with post-2000 optical data from more sophisticated satellites, which more directly convey elevation changes.
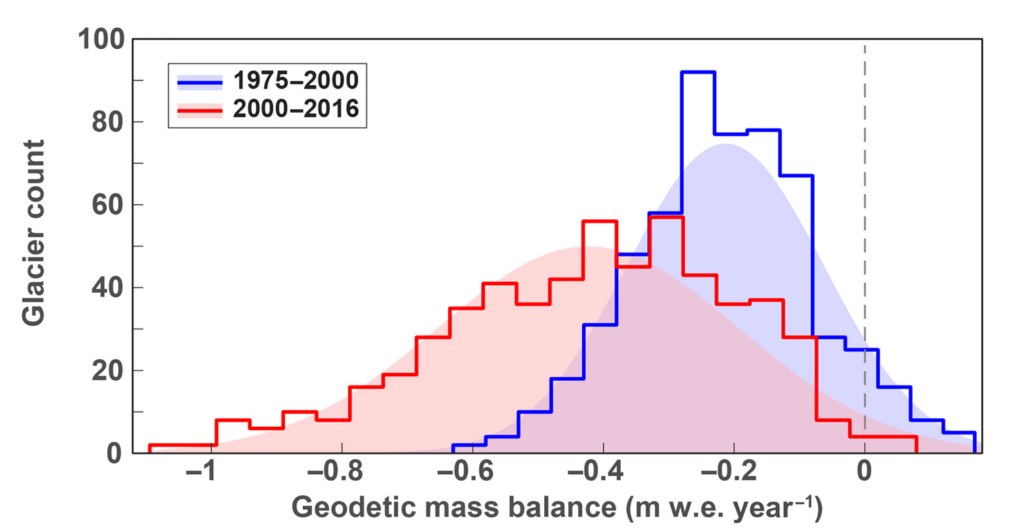
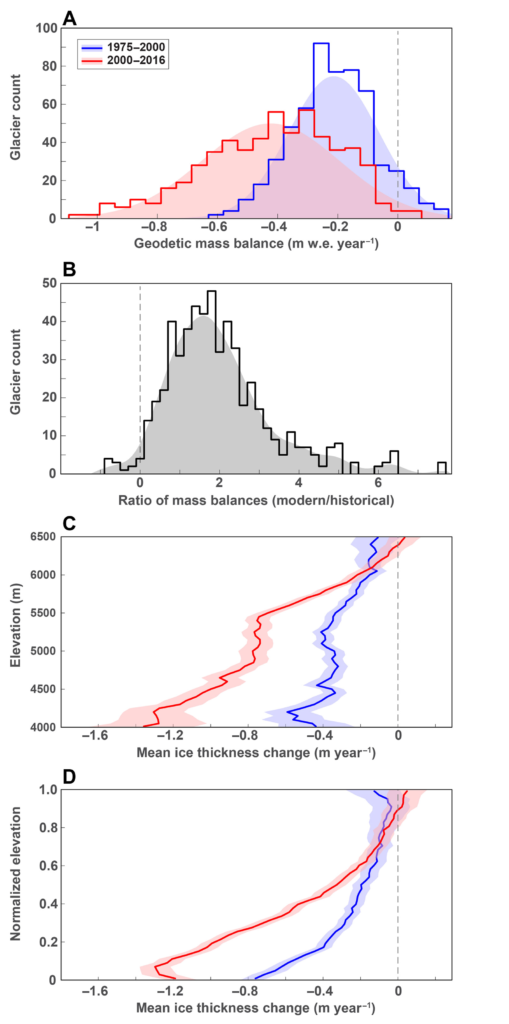
They found that from 1975 to 2000, glaciers across the region lost an average of about 0.25 meters (10 inches) of ice each year in the face of slight warming. Following a more pronounced warming trend starting in the 1990s, starting in 2000 the loss accelerated to about half a meter (20 inches) annually. Recent yearly losses have averaged about 8 billion tons of water, or the equivalent 3.2 million Olympic-size swimming pools, says Maurer. Most individual glaciers are not wasting uniformly over their entire surfaces, he noted; melting has been concentrated mainly at lower elevations, where some ice surfaces are losing as much as 5 meters (16 feet) a year.
Some researchers have argued that factors other than temperature are affecting the glaciers. These include changes in precipitation, which seems to be declining in some areas (which would tend to reduce the ice), but increasing in others (which would tend to build it). Another factor: Asian nations are burning ever-greater loads of fossil fuels and biomass, sending soot into the sky. Much of it eventually lands on snowy glacier surfaces, where it absorbs solar energy and hastens melting. Maurer agrees that both soot and precipitation are factors, but due to the region’s huge size and extreme topography, the effects are highly variable from place to place. Overall, he says, temperature is the overarching force. To confirm this, he and his colleagues compiled temperature data during the study period from ground stations and then calculated the amount of melting that observed temperature increases would be expected to produce. They then compared those figures with what actually happened. They matched. “It looks just like what we would expect if warming were the dominant driver of ice loss,” he said.
Ice loss in the Himalayas resembles the far more closely studied European Alps, where temperatures started going up somewhat earlier, in the 1980s. Glaciers there started wasting shortly after that increase, and rapid loss of ice has continued since then. The Himalayas are generally not melting as fast as the Alps, but the general progression is similar, say the researchers. The study does not include the huge adjoining ranges of high-mountain Asia such as the Pamir, Hindu Kush or Tian Shan, but other studies suggest similar melting is underway there as well.
Some 800 million people depend in part on seasonal runoff from Himalayan glaciers for irrigation, hydropower and drinking water. The accelerated melting appears so far to be swelling runoff during warm seasons, but scientists project that this will taper off within decades as the glaciers lose mass. This, they say, will eventually lead to water shortages. A separate study published this May estimates that yearly runoff is now about 1.6 times greater than if the glaciers were replenished at the same rate they were melting. As a result, in many high-mountain drainages, meltwater lakes are building rapidly behind natural dams of rocky debris; these are threatening downstream communities with potentially destructive and deadly outburst floods. Even on Mount Everest, long-lost corpses of climbers who failed to return are emerging from melting ice and snow along trails.
The study shows that “even glaciers in the highest mountains of the world are responding to global air temperature increases driven by the combustion of fossil fuels,” said Joseph Shea, a glacial geographer at the University of Northern British Columbia who was not involved in the study. “In the long term, this will lead to changes in the timing and magnitude of streamflow in a heavily populated region.”
“It shows how endangered [the Himalayas] are if climate change continues at the same pace in the coming decades,” said Etienne Berthier, a glaciologist at France’s Laboratory for Studies in Geophysics and Spatial Oceanography, who also was not involved in the study.
The study was coauthored by Joerg Schaefer and Alison Corley of Lamont-Doherty Earth Observatory, and Summer Rupper of the University of Utah.
Melting of Himalayan Glaciers Has Doubled in Recent Years
Acceleration of ice loss across the Himalayas over the past 40 years
ABSTRACT: Himalayan glaciers supply meltwater to densely populated catchments in South Asia, and regional observations of glacier change over multiple decades are needed to understand climate drivers and assess resulting impacts on glacier-fed rivers. Here, we quantify changes in ice thickness during the intervals 1975–2000 and 2000–2016 across the Himalayas, using a set of digital elevation models derived from cold war–era spy satellite film and modern stereo satellite imagery. We observe consistent ice loss along the entire 2000-km transect for both intervals and find a doubling of the average loss rate during 2000–2016 [−0.43 ± 0.14 m w.e. year−1 (meters of water equivalent per year)] compared to 1975–2000 (−0.22 ± 0.13 m w.e. year−1). The similar magnitude and acceleration of ice loss across the Himalayas suggests a regionally coherent climate forcing, consistent with atmospheric warming and associated energy fluxes as the dominant drivers of glacier change.
Acceleration of ice loss across the Himalayas over the past 40 years