Most of the world faces record-high temperatures every year without serious climate action
By Brandon Specktor
17 June 2019
(Live Science) – When I say, “how about that heat wave,” perhaps you think of the western United States, where temperatures last week soared above 120 degrees Fahrenheit (49 degrees Celsius), smashing dozens of historical heat records from Oregon to Arizona.
Or maybe you think of India — where intense heat has scorched the country for more than a month, killing at least 36 people and forcing hundreds of thousands to evacuate their villages — or perhaps Kuwait, where local media recently reported high temperatures of 145 F (63 C), potentially the highest temperature ever recorded on Earth.
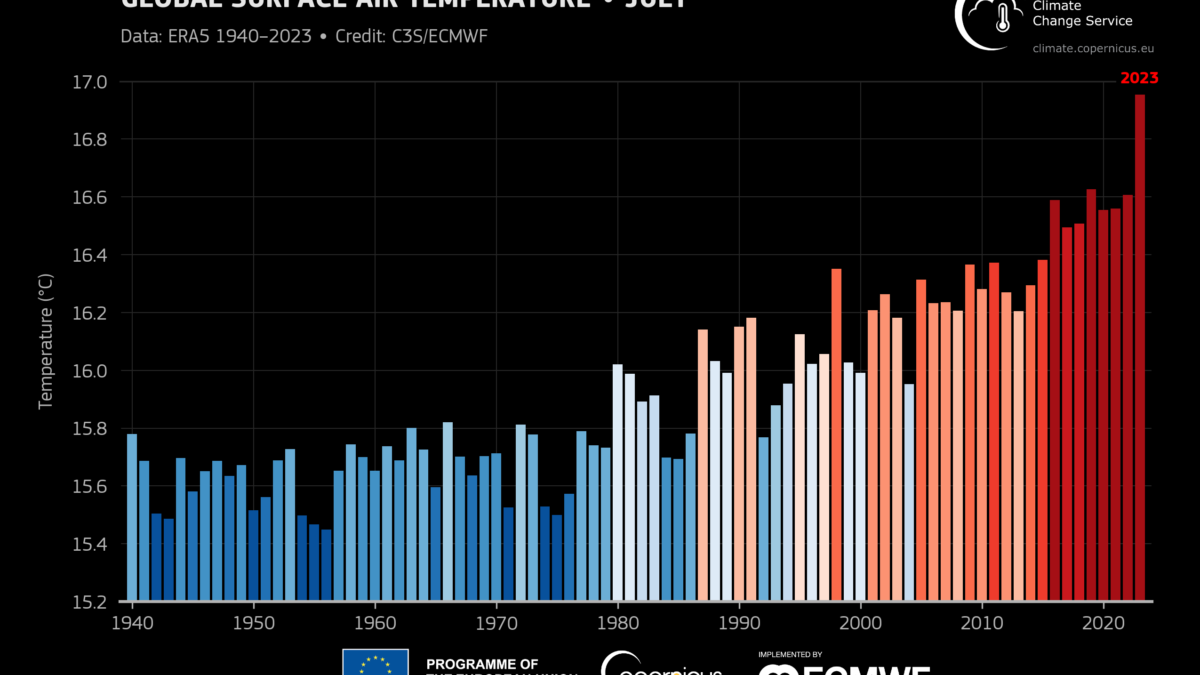
The point is, the Northern Hemisphere is really, really hot right now and summer has barely begun. If it seems like these record heat waves are happening more often, that’s because they are — and, according to a new study published today (17 June 2019) in the journal Nature Climate Change, this scorching trend will continue for most of the globe every single year as long as no action is taken to reduce greenhouse gas emissions. [The Reality of Climate Change: 10 Myths Busted]
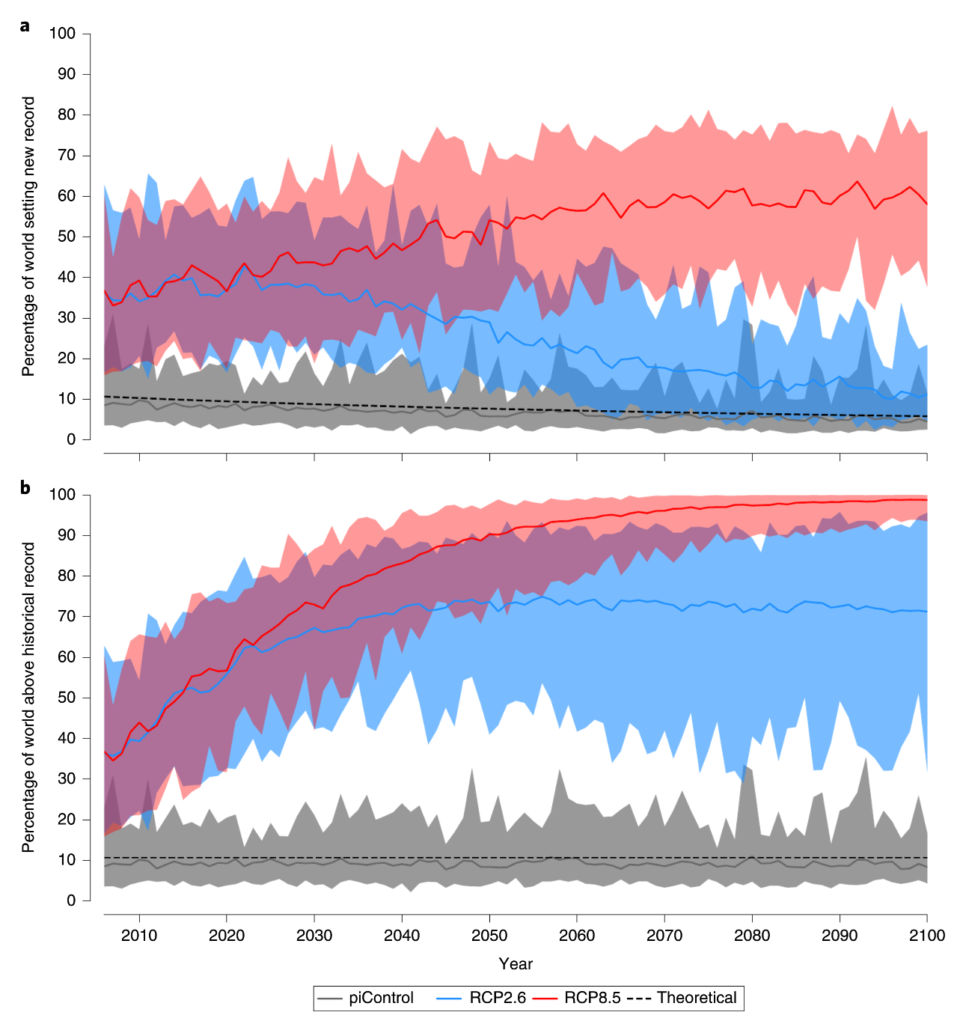
In the new study, a team of Australian meteorologists analyzed the predictions in 22 separate climate reports to calculate one range of überpredictions about our planet’s hot, hot future. The scientists found that, under current levels of greenhouse gas emissions, high monthly temperature records will be set in approximately 58% of the world (including 67% of the poorest nations) every single year until 2100. Nearly 10% of the world will also have at least one monthly temperature record “smashed” by more than 1.8 F (1 C) every year. […]
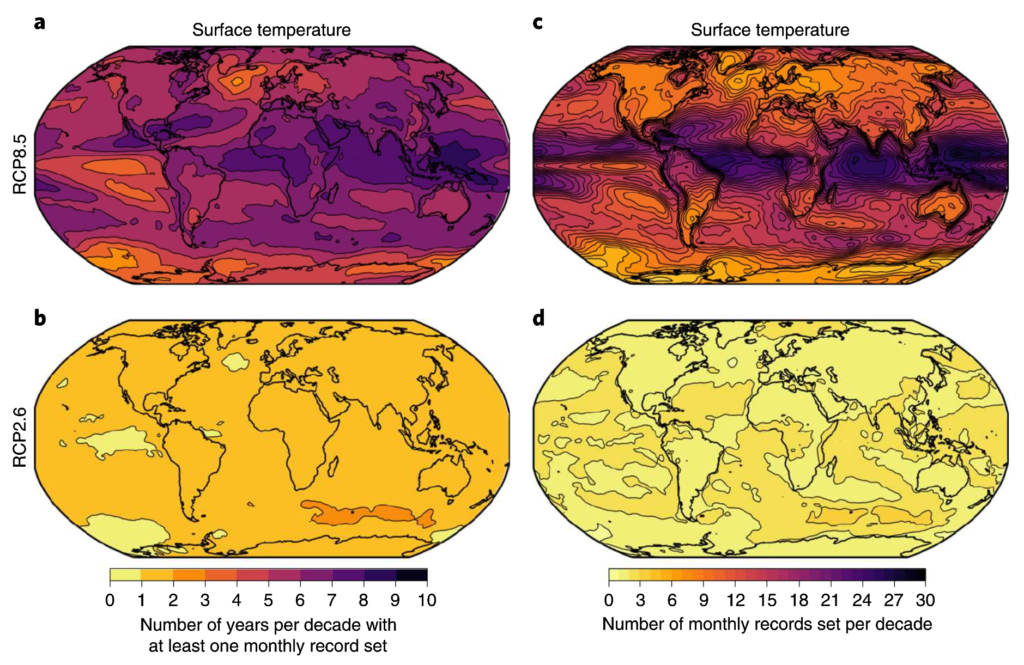
The team found that many nations near the equator can expect to see 24 monthly heat records surpassed every decade that emissions remain unchecked — in other words, roughly two months of every year will be hotter than in any year before it. Under the low-emissions model, that number drops to less than three records per decade. [more]
Most of the World to Face Record-High Temperatures Every Year Without Serious Climate Action
ABSTRACT: Changes in the intensity or frequency of extreme climate events can profoundly increase the disruption caused by climate change1,2,3,4. The more extreme these events, the greater the potential to push ecosystems and communities beyond their ability to cope3,5. The rate at which existing high temperature records have been broken has increased in response to rising global greenhouse gas emissions (GGHGEs)2,6,7,8, and the rate at which historical records are surpassed is projected to increase further over the coming century1,2,9,10. Here we examine future events that will be so extreme that they will not have been experienced previously. Record setting in 22 climate models11 indicates that, by the end of the twenty-first century, under business-as-usual increases in GGHGEs (representative concentration pathway (RCP) 8.5 (ref. 12)), high monthly mean temperature records will be set in approximately 58% of the world every year, and in 67% of least developed countries and 68% of small island developing states. These figures all drop to 14% under a scenario with much lower GHG concentrations (RCP2.6 (ref. 12)). In any given year, the likelihood of ‘smashing’ at least one monthly record by more than 1.0 °C is much less likely under RCP2.6 than it is under RCP8.5 (1.1 versus 8.9%).
Setting and smashing extreme temperature records over the coming century