Global carbon emissions hit record high in 2018 – Global energy demand rose at fastest pace in last decade, driven by record temperature extremes
By Nina Chestney
26 March 2019
LONDON (Reuters) – Global energy-related carbon emissions rose to a record high last year as energy demand and coal use increased, mainly in Asia, the International Energy Agency (IEA) said on Tuesday.
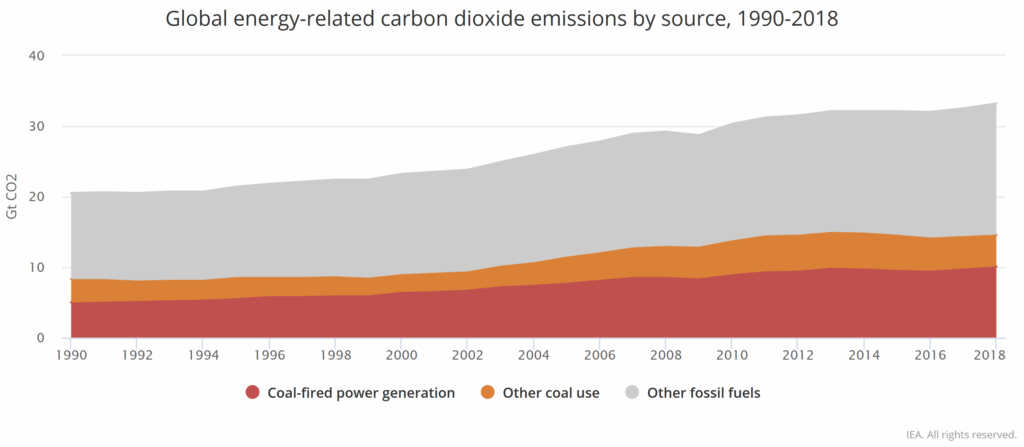
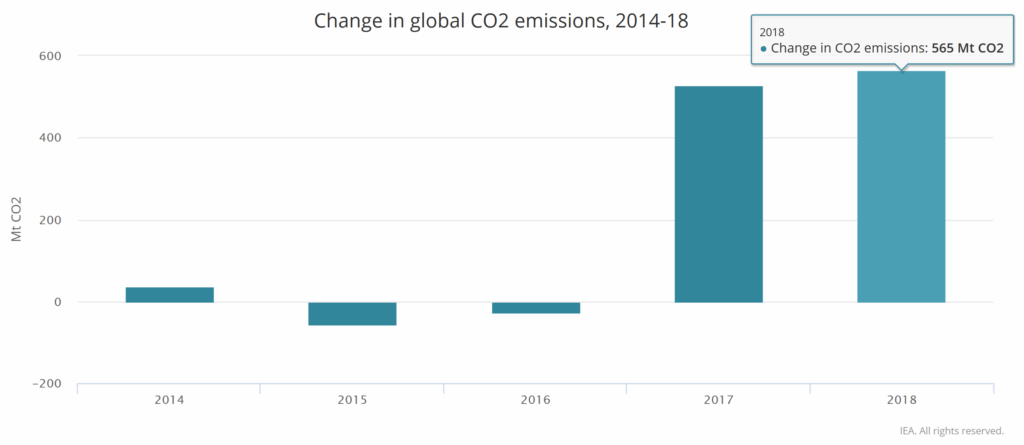
Energy-related CO2 emissions rose by 1.7 percent to 33.1 billion tonnes from the previous year, the highest rate of growth since 2013, with the power sector accounting for almost two-thirds of this growth, according to IEA estimates.
The United States’ CO2 emissions grew by 3.1 percent in 2018, reversing a decline a year earlier, while China’s emissions rose by 2.5 percent and India’s by 4.5 percent.
Europe’s emissions fell by 1.3 percent and Japan’s fell for the fifth year running.
Carbon dioxide emissions are the primary cause of global average temperature rise which countries are seeking to curb to avoid the most devastating effects of climate change.
For the first time, the IEA assessed the impact of fossil fuel use on the increase in global temperature and found that CO2 emitted from coal consumption was responsible for over 0.3 degrees Celsius of the 1 degree rise in global average temperature since pre-industrial times.
Global energy demand grew by 2.3 percent in 2018, nearly twice the average rate of growth since 2010, driven by a strong global economy and higher heating and cooling demand in some parts of the world, the IEA said. [more]
Global carbon emissions hit record high in 2018: IEA
Global energy demand rose by 2.3% in 2018, its fastest pace in the last decade
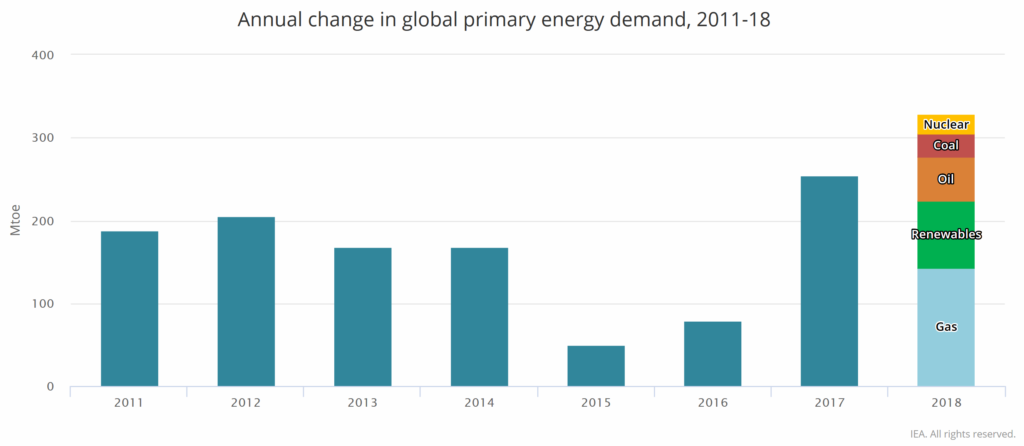
26 March 2019 (IEA) – Energy demand worldwide grew by 2.3% last year, its fastest pace this decade, an exceptional performance driven by a robust global economy and stronger heating and cooling needs in some regions. Natural gas emerged as the fuel of choice, posting the biggest gains and accounting for 45% of the rise in energy consumption. Gas demand growth was especially strong in the United States and China.
Demand for all fuels increased, with fossil fuels meeting nearly 70% of the growth for the second year running. Solar and wind generation grew at double-digit pace, with solar alone increasing by 31%. Still, that was not fast enough to meet higher electricity demand around the world that also drove up coal use.
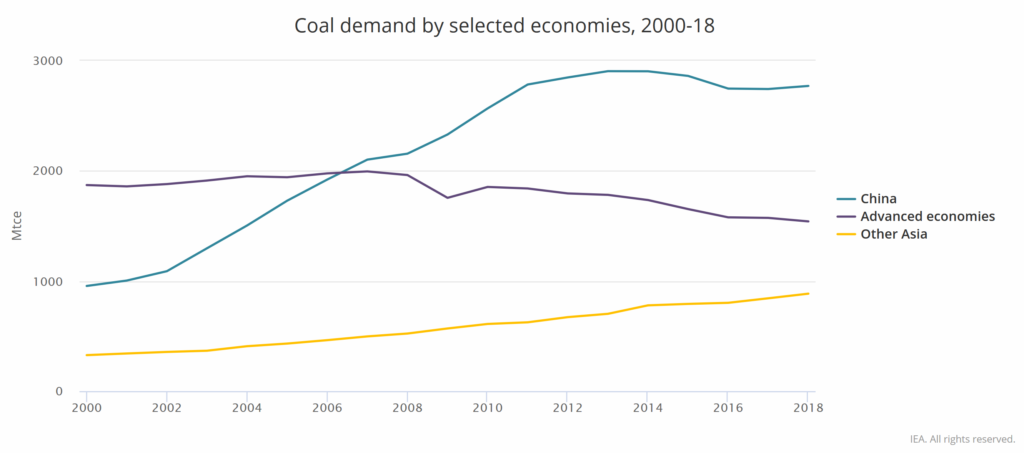
As a result, global energy-related CO2 emissions rose by 1.7% to 33 Gigatonnes (Gt) in 2018. Coal use in power generation alone surpassed 10 Gt, accounting for a third of the total increase. Most of that came from a young fleet of coal power plants in developing Asia. The majority of coal-fired generation capacity today is found in Asia, with 12-year-old plants on average, decades short of average lifetimes of around 50 years.
These findings are part of the International Energy Agency’s latest assessment of global energy consumption and energy-related CO2 emissions for 2018. The Global Energy & CO2 Status Report provides a high-level and up-to-date view of energy markets, including latest available data for oil, natural gas, coal, wind, solar, nuclear power, electricity, and energy efficiency.
Electricity continues to position itself as the “fuel” of the future, with global electricity demand growing by 4% in 2018 to more than 23 000 TWh. This rapid growth is pushing electricity towards a 20% share in total final consumption of energy. Increasing power generation was responsible for half of the growth in primary energy demand.
Renewables were a major contributor to this power generation expansion, accounting for nearly half of electricity demand growth. China remains the leader in renewables, both for wind and solar, followed by Europe and the United States.
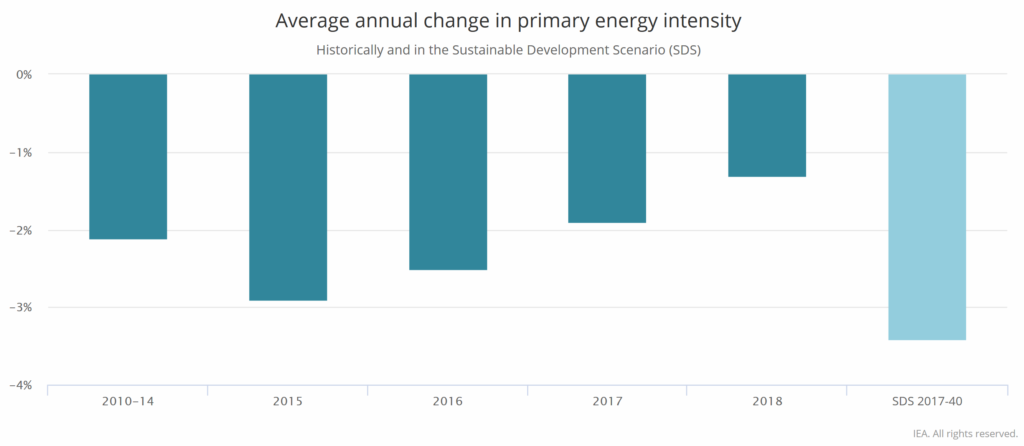
Energy intensity improved by 1.3% last year, just half the rate of the period between 2014-2016. This third consecutive year of slowdown was the result of weaker energy efficiency policy implementation and strong demand growth in more energy intensive economies.
“We have seen an extraordinary increase in global energy demand in 2018, growing at its fastest pace this decade,” said Dr Fatih Birol, the IEA’s Executive Director. “Last year can also be considered another golden year for gas, which accounted for almost half the growth in global energy demand. But despite major growth in renewables, global emissions are still rising, demonstrating once again that more urgent action is needed on all fronts — developing all clean energy solutions, curbing emissions, improving efficiency, and spurring investments and innovation, including in carbon capture, utilization and storage.”
Almost a fifth of the increase in global energy demand came from higher demand for heating and cooling as average winter and summer temperatures in some regions approached or exceeded historical records. Cold snaps drove demand for heating and, more significantly, hotter summer temperatures pushed up demand for cooling.
Together, China, the United States, and India accounted for nearly 70% of the rise in energy demand around the world. The United States saw the largest increase in oil and gas demand worldwide. Its gas consumption jumped 10% from the previous year, the fastest increase since the beginning of IEA records in 1971. The annual increase in US demand last year was equivalent to the United Kingdom’s current gas consumption.
Global gas demand expanded at its fastest rate since 2010, with year-on-year growth of 4.6%, the second consecutive year of strong growth, driven by higher demand and substitution from coal. Demand growth was led by the United States. Gas demand in China increased by almost 18%.
Oil demand grew 1.3% worldwide, with the United States again leading the global increase for the first time in 20 years thanks to a strong expansion in petrochemicals, rising industrial production and trucking services.
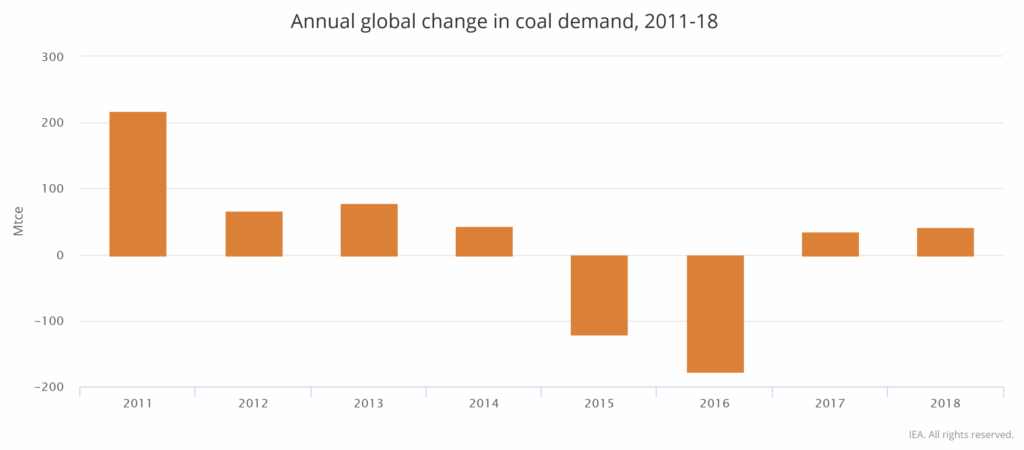
Global coal consumption rose 0.7%, with increases seen only in Asia, particularly in China, India and a few countries in South and Southeast Asia.
Nuclear also grew by 3.3% in 2018, with global generation reaching pre-Fukushima levels, mainly as a result of new additions in China and the restart of four reactors in Japan. Worldwide, nuclear plants met 9% of the increase in electricity demand.
Global energy demand rose by 2.3% in 2018, its fastest pace in the last decade