Global warming of oceans equivalent to an atomic bomb per second – Total heat taken up by oceans over the past 150 years was 1,000 times the annual energy use of the entire global population

By Damian Carrington
7 January 2019
(The Guardian) – Global warming has heated the oceans by the equivalent of one atomic bomb explosion per second for the past 150 years, according to analysis of new research.More than 90% of the heat trapped by humanity’s greenhouse gas emissions has been absorbed by the seas, with just a few per cent heating the air, land and ice caps respectively. The vast amount of energy being added to the oceans drives sea-level rise and enables hurricanes and typhoons to become more intense.
Much of the heat has been stored in the ocean depths but measurements here only began in recent decades and existing estimates of the total heat the oceans have absorbed stretch back only to about 1950. The new work extends that back to 1871. Scientists have said that understanding past changes in ocean heat was critical for predicting the future impact of climate change.
A Guardian calculation found the average heating across that 150-year period was equivalent to about 1.5 Hiroshima-size atomic bombs per second. But the heating has accelerated over that time as carbon emissions have risen, and was now the equivalent of between three and six atomic bombs per second.
“I try not to make this type of calculation, simply because I find it worrisome,” said Prof Laure Zanna, at the University of Oxford, who led the new research. “We usually try to compare the heating to [human] energy use, to make it less scary.”
She added: “But obviously, we are putting a lot of excess energy into the climate system and a lot of that ends up in the ocean. There is no doubt.”
The total heat taken up by the oceans over the past 150 years was about 1,000 times the annual energy use of the entire global population.The research has been published in the journal Proceedings of the National Academy of Sciences and combined measurements of the surface temperature of the ocean since 1871 with computer models of ocean circulation. [more]
Global warming of oceans equivalent to an atomic bomb per second
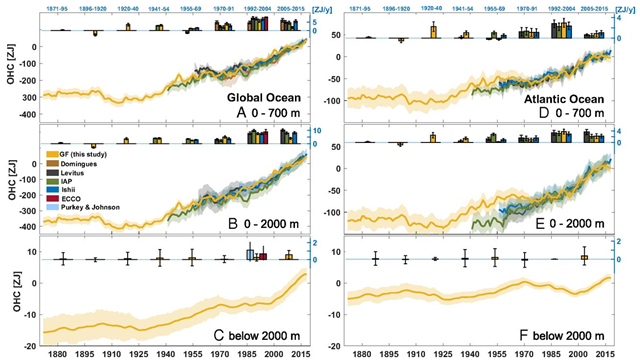
ABSTRACT: Most of the excess energy stored in the climate system due to anthropogenic greenhouse gas emissions has been taken up by the oceans, leading to thermal expansion and sea-level rise. The oceans thus have an important role in the Earth’s energy imbalance. Observational constraints on future anthropogenic warming critically depend on accurate estimates of past ocean heat content (OHC) change. We present a reconstruction of OHC since 1871, with global coverage of the full ocean depth. Our estimates combine timeseries of observed sea surface temperatures with much longer historical coverage than those in the ocean interior together with a representation (a Green’s function) of time-independent ocean transport processes. For 1955–2017, our estimates are comparable with direct estimates made by infilling the available 3D time-dependent ocean temperature observations. We find that the global ocean absorbed heat during this period at a rate of 0.30 ± 0.06 W/m2 in the upper 2,000 m and 0.028 ± 0.026 W/m2 below 2,000 m, with large decadal fluctuations. The total OHC change since 1871 is estimated at 436 ± 91 ×1021 J, with an increase during 1921–1946 (145 ± 62 ×1021 J) that is as large as during 1990–2015. By comparing with direct estimates, we also infer that, during 1955–2017, up to one-half of the Atlantic Ocean warming and thermosteric sea-level rise at low latitudes to midlatitudes emerged due to heat convergence from changes in ocean transport.
SIGNIFICANCE: Since the 19th century, rising greenhouse gas concentrations have caused the ocean to absorb most of the Earth’s excess heat and warm up. Before the 1990s, most ocean temperature measurements were above 700 m and therefore, insufficient for an accurate global estimate of ocean warming. We present a method to reconstruct ocean temperature changes with global, full-depth ocean coverage, revealing warming of 436 ×1021 J since 1871. Our reconstruction, which agrees with other estimates for the well-observed period, demonstrates that the ocean absorbed as much heat during 1921–1946 as during 1990–2015. Since the 1950s, up to one-half of excess heat in the Atlantic Ocean at midlatitudes has come from other regions via circulation-related changes in heat transport.
Global reconstruction of historical ocean heat storage and transport