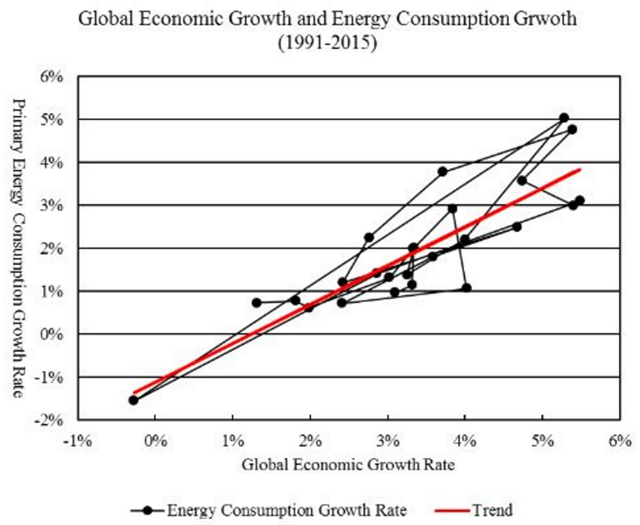
Graph of the Day: Global economic growth and energy consumption growth, 1991-2015
By Political Economist
20 June 2016
(Peak Oil Barrel) – […] This graph compares the historical world economic growth rates and the primary energy consumption growth rates from 1991 to 2015. The primary energy consumption growth rate has an intercept of -0.011 at zero economic growth rate and a slope of 0.904. That is, primary energy consumption has an ‘autonomous’ tendency to fall by 1.1 percent a year when economic growth rate is zero. When economic growth rate rises above zero, an increase in economic growth rate by one percentage point is associated with an increase in primary energy consumption by 0.9 percent. R-square for the linear trend is 0.751. Source: Gross world product in constant 2011 international dollars is from World Bank (2016); world primary energy consumption is from BP (2016). World average energy efficiency was 8,136 dollars per ton of oil equivalent in 2015. From 2010 to 2015, world average energy efficiency grew at an average annual rate of 1.8 percent. World carbon dioxide emissions from fossil fuels burning were 33.5 billion tons in 2015. From 2010 to 2015, world carbon dioxide emissions grew at an average annual rate of 1.2 percent. World average emissions intensity of gross world product was 0.313 kilogram of carbon dioxide emissions per dollar of gross world product. From 2010 to 2015, world average emissions intensity of gross world product declined at an average annual rate of 2.1 percent. World average emissions intensity of primary energy consumption was 2.55 tons of carbon dioxide emissions per ton of oil equivalent. From 2010 to 2015, world average emissions intensity of primary energy consumption declined at an average annual rate of 0.3 percent.
