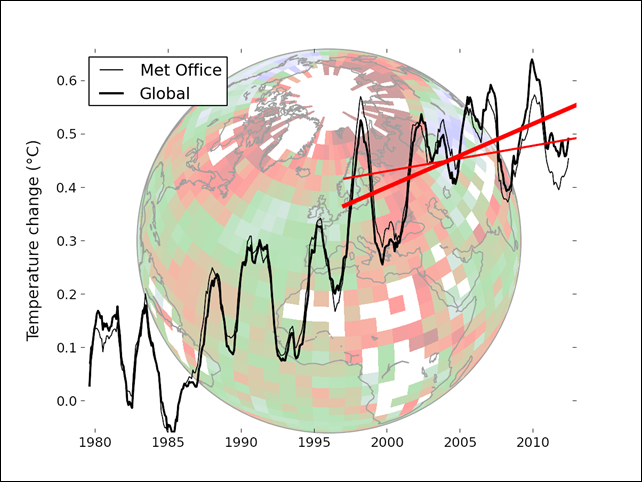
Global warming since 1997 underestimated by half
By Stefan Rahmstorf
13 November 2013 (RealClimate) – A new study by British and Canadian researchers shows that the global temperature rise of the past 15 years has been greatly underestimated. The reason is the data gaps in the weather station network, especially in the Arctic. If you fill these data gaps using satellite measurements, the warming trend is more than doubled in the widely used HadCRUT4 data, and the much-discussed “warming pause” has virtually disappeared. Obtaining the globally averaged temperature from weather station data has a well-known problem: there are some gaps in the data, especially in the polar regions and in parts of Africa. As long as the regions not covered warm up like the rest of the world, that does not change the global temperature curve. But errors in global temperature trends arise if these areas evolve differently from the global mean. That’s been the case over the last 15 years in the Arctic, which has warmed exceptionally fast, as shown by satellite and reanalysis data and by the massive sea ice loss there. This problem was analysed for the first time by Rasmus in 2008 at RealClimate, and it was later confirmed by other authors in the scientific literature. The “Arctic hole” is the main reason for the difference between the NASA GISS data and the other two data sets of near-surface temperature, HadCRUT and NOAA. I have always preferred the GISS data because NASA fills the data gaps by interpolation from the edges, which is certainly better than not filling them at all. Now Kevin Cowtan (University of York) and Robert Way (University of Ottawa) have developed a new method to fill the data gaps using satellite data. It sounds obvious and simple, but it’s not. Firstly, the satellites cannot measure the near-surface temperatures but only those overhead at a certain altitude range in the troposphere. And secondly, there are a few question marks about the long-term stability of these measurements (temporal drift). Cowtan and Way circumvent both problems by using an established geostatistical interpolation method called kriging – but they do not apply it to the temperature data itself (which would be similar to what GISS does), but to the difference between satellite and ground data. So they produce a hybrid temperature field. This consists of the surface data where they exist. But in the data gaps, it consists of satellite data that have been converted to near-surface temperatures, where the difference between the two is determined by a kriging interpolation from the edges. As this is redone for each new month, a possible drift of the satellite data is no longer an issue. Prerequisite for success is, of course, that this difference is sufficiently smooth, i.e., has no strong small-scale structure. This can be tested on artificially generated data gaps, in places where one knows the actual surface temperature values but holds them back in the calculation. Cowtan and Way perform extensive validation tests, which demonstrate that their hybrid method provides significantly better results than a normal interpolation on the surface data as done by GISS. Cowtan and Way apply their method to the HadCRUT4 data, which are state-of-the-art except for their treatment of data gaps. For 1997-2012 these data show a relatively small warming trend of only 0.05 °C per decade – which has often been misleadingly called a “warming pause”. […] But after filling the data gaps this trend is 0.12 °C per decade and thus exactly equal to the long-term trend mentioned by the IPCC. [more]
