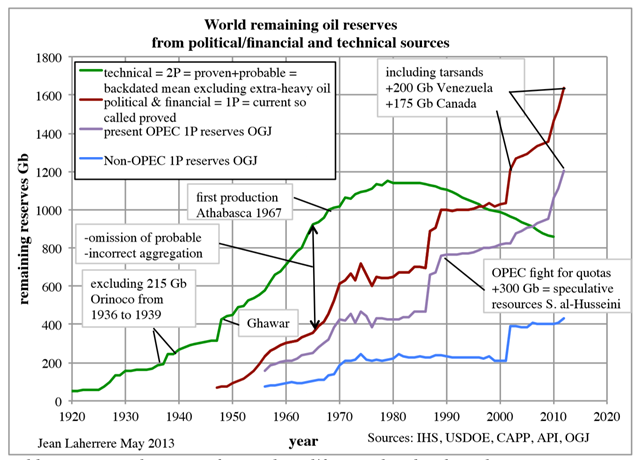
Graph of the Day: World remaining oil reserve estimates by political and technical sources, 1920-2012
By Jean Laherrere
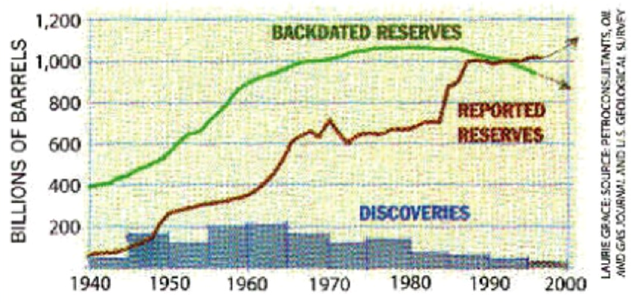
16 May 29013 (tribune-pic-petrolier.org) – It is well known that OPEC reserves were inflated after the 1986 oil counter chock, because the fight on quotas mainly based on reserves. Over 1986-89, 300 Gb of “political” reserves were added (not involving extra-heavy (XH) oil). This was confirmed by the former Aramco VP Sadad al-Husseini in 2007 in London. Later, in 2001, the definition of oil was changed with EIA/OGJ data and XH oil reserves were added, first for Canada (Athabasca) and then for Venezuela (Orinoco). These XH oil have been reported for a long time (Orinoco discoveries in 1936-39 (215 Gb) and Athabasca tarsands are known since the 18th century and produced since 1967,but reported separately as bitumen). The plot of the Non-OPEC from OGJ [upper] is flat since 1970 except for the increase in 2002 for 200 Gb Athabasca reserves (in production since 1967) It is strange that the Non-OPEC proved reserves outside Athabasca can stay flat for the last 60 years, meaning that production is always replaced by discoveries: this means that these reserves are political. The OGJ proved reserves of Spain stay identical at 150 Mb since 2006 to 2012, with a cumulative production of 75 Mb during this period and Belarus at 198 Mb since 1996 to 2012 with a cumulative production of 211 Mb. In fact when OGJ does not receive any reply from their request of data, they simply assumer that there is no change with production replaced by new discovery, difficult assumption when it covers 15 years! The same graph [lower] in our (Campbell & Laherrere) March 1998 paper in Scientific American “The End of Cheap Oil” is confirmed, when we expect the green curve to go down and the brown curve to go up, but we did not expect to move so high (+600 Gb) after a long plateau!
Shortened world oil & gas production forecasts 1900-2100 [pdf]