Graph of the Day: Cumulative U.S. groundwater depletion, 1900-2008
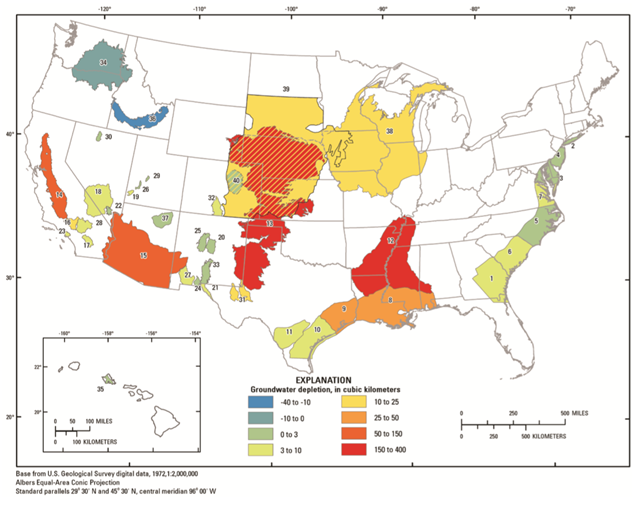
(USGS) – Map of the United States (excluding Alaska) showing cumulative groundwater depletion, 1900 through 2008, in 40 assessed aquifer systems or subareas. Colors are hatched in the Dakota aquifer (area 39) where the aquifer overlaps with other aquifers having different values of depletion. Graphic: USGS ABSTRACT: A natural consequence of groundwater withdrawals is the removal of water from subsurface storage, but the overall rates and magnitude of groundwater depletion in the United States are not well characterized. This study evaluates long-term cumulative depletion volumes in 40 separate aquifers or areas and one land use category in the United States, bringing together information from the literature and from new analyses. Depletion is directly calculated using calibrated groundwater models, analytical approaches, or volumetric budget analyses for multiple aquifer systems. Estimated groundwater depletion in the United States during 1900–2008 totals approximately 1,000 cubic kilometers (km3). Furthermore, the rate of groundwater depletion has increased markedly since about 1950, with maximum rates occurring during the most recent period (2000–2008) when the depletion rate averaged almost 25 km3 per year (compared to 9.2 km3 per year averaged over the 1900–2008 timeframe).