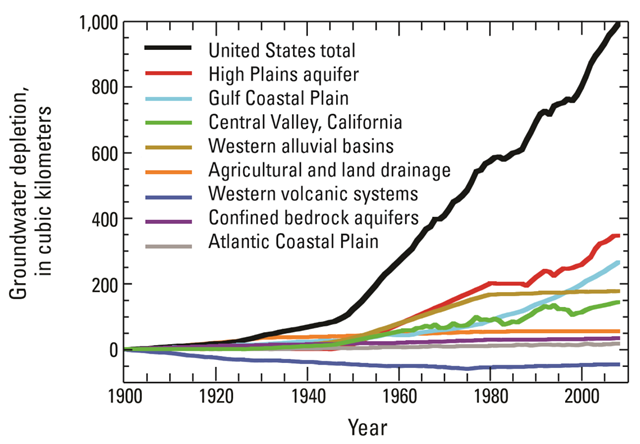
Graph of the Day: Cumulative groundwater depletion in the U.S. and major aquifer systems or categories, 1900-2008
Cumulative groundwater depletion in the United States and major aquifer systems or categories, 1900 through 2008. Graphic: USGS / Konikow, 2011
In addition to widely recognized adverse environmental effects of groundwater depletion, the depletion also impacts communities dependent on groundwater resources in that the continuation of depletion at observed rates makes the water supply unsustainable in the long term. However, depletion itself must certainly be unsustainable and the observed rates of depletion must eventually decrease as economic and physical constraints lead to reduced levels of extraction. Yet the data in table 2 and figure 57 demonstrate that the rates of depletion for some of the major aquifer system and land use categories during 2001–2008 are the highest since 1900, and in fact account for 25 percent of the total depletion during the 108-year period. Nevertheless, the rate of depletion is leveling off or becoming self-limiting in a number of areas, most notably the western alluvial basins (since 1980) and to a lesser degree the Central Valley (since the early 1990s). Konikow (2011) also notes that oceans represent the ultimate sink for essentially all depleted groundwater. The surface area of the oceans is approximately 3.61×10⁸ km2 (Duxbury and others, 2000). If the estimated volumes of depletion were spread across the surface of the oceans, it would account for approximately 2.2 mm of sea-level rise from 1900 through 2000 and 2.8 mm of sea-level rise from 1900 through 2008. The observed rate of sea-level rise during the 20th century averaged about 1.7 mm/yr, but had increased to about 3.1 mm/yr since 2000 (Bindorf and others, 2007). Thus, depletion in the United States alone can explain 1.3 percent of the sea-level rise observed during the 20th century, and 2.3 percent of the observed rate of sea-level rise during 2001–2008.
