Marcott, et al., respond to criticisms of their groundbreaking paper that shows 11,000 years of climate change
31 March 2013 (RealClimate) – Readers will be aware of the paper by Shaun Marcott and colleagues, that they published a couple weeks ago in the journal Science. That paper sought to extend the global temperature record back over the entire Holocene period, i.e. just over 11 kyr back time, something that had not really been attempted before. The paper got a fair amount of media coverage (see, e.g., this article by Justin Gillis in The New York Times). Since then, a number of accusations from the usual suspects have been leveled against the authors and their study, and most of it is characteristically misleading. We are pleased to provide the authors’ response, below. Our view is that the results of the paper will stand the test of time, particularly regarding the small global temperature variations in the Holocene. If anything, early Holocene warmth might be overestimated in this study. Summary and FAQs related to the study by Marcott, et al. (2013, Science) Prepared by Shaun A. Marcott, Jeremy D. Shakun, Peter U. Clark, and Alan C. Mix
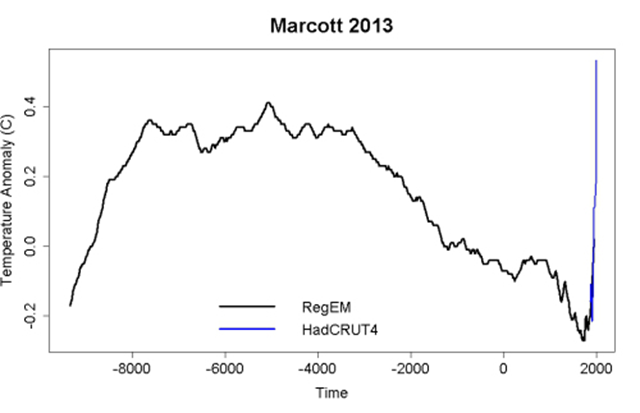
[…] Q: Why use marine and terrestrial archives to reconstruct global temperature when we have the ice cores from Greenland and Antarctica? A: While we do use these ice cores in our study, they are limited to the polar regions and so give only a local or regional picture of temperature changes. Just as it would not be reasonable to use the recent instrumental temperature history from Greenland (for example) as being representative of the planet as a whole, one would similarly not use just a few ice cores from polar locations to reconstruct past temperature change for the entire planet. Q: Why only look at temperatures over the last 11,300 years? A: Our work was the second half of a two-part study assessing global temperature variations since the peak of the last Ice Age about 22,000 years ago. The first part reconstructed global temperature over the last deglaciation (22,000 to 11,300 years ago) (Shakun, et al., 2012, Nature 484, 49-55; see also http://www.people.fas.harvard.edu/~shakun/FAQs.html), while our study focused on the current interglacial warm period (last 11,300 years), which is roughly the time span of developed human civilizations. Q: Is your paleotemperature reconstruction consistent with reconstructions based on the tree-ring data and other archives of the past 2,000 years? A: Yes, in the parts where our reconstruction contains sufficient data to be robust, and acknowledging its inherent smoothing. For example, our global temperature reconstruction from ~1500 to 100 years ago is indistinguishable (within its statistical uncertainty) from the Mann et al. (2008) reconstruction, which included many tree-ring based data. Both reconstructions document a cooling trend from a relatively warm interval (~1500 to 1000 years ago) to a cold interval (~500 to 100 years ago, approximately equivalent to the Little Ice Age). Q: What do paleotemperature reconstructions show about the temperature of the last 100 years? A: Our global paleotemperature reconstruction includes a so-called “uptick” in temperatures during the 20th-century. However, in the paper we make the point that this particular feature is of shorter duration than the inherent smoothing in our statistical averaging procedure, and that it is based on only a few available paleo-reconstructions of the type we used. Thus, the 20th century portion of our paleotemperature stack is not statistically robust, cannot be considered representative of global temperature changes, and therefore is not the basis of any of our conclusions. Our primary conclusions are based on a comparison of the longer term paleotemperature changes from our reconstruction with the well-documented temperature changes that have occurred over the last century, as documented by the instrumental record. Although not part of our study, high-resolution paleoclimate data from the past ~130 years have been compiled from various geological archives, and confirm the general features of warming trend over this time interval (Anderson, D.M. et al., 2013, Geophysical Research Letters, v. 40, p. 189-193; pdf). Q: Is the rate of global temperature rise over the last 100 years faster than at any time during the past 11,300 years? A: Our study did not directly address this question because the paleotemperature records used in our study have a temporal resolution of ~120 years on average, which precludes us from examining variations in rates of change occurring within a century. Other factors also contribute to smoothing the proxy temperature signals contained in many of the records we used, such as organisms burrowing through deep-sea mud, and chronological uncertainties in the proxy records that tend to smooth the signals when compositing them into a globally averaged reconstruction. We showed that no temperature variability is preserved in our reconstruction at cycles shorter than 300 years, 50% is preserved at 1000-year time scales, and nearly all is preserved at 2000-year periods and longer. Our Monte-Carlo analysis accounts for these sources of uncertainty to yield a robust (albeit smoothed) global record. Any small “upticks” or “downticks” in temperature that last less than several hundred years in our compilation of paleoclimate data are probably not robust, as stated in the paper. Q: How do you compare the Holocene temperatures to the modern instrumental data? A: One of our primary conclusions is based on Figure 3 of the paper, which compares the magnitude of global warming seen in the instrumental temperature record of the past century to the full range of temperature variability over the entire Holocene based on our reconstruction. We conclude that the average temperature for 1900-1909 CE in the instrumental record was cooler than ~95% of the Holocene range of global temperatures, while the average temperature for 2000-2009 CE in the instrumental record was warmer than ~75% of the Holocene distribution. As described in the paper and its supplementary material, Figure 3 provides a reasonable assessment of the full range of Holocene global average temperatures, including an accounting for high-frequency changes that might have been damped out by the averaging procedure. [more]