Graph of the Day: Estimated vehicle miles driven on all U.S. roads, adjusted for population growth, 1971-2013
By Doug Short
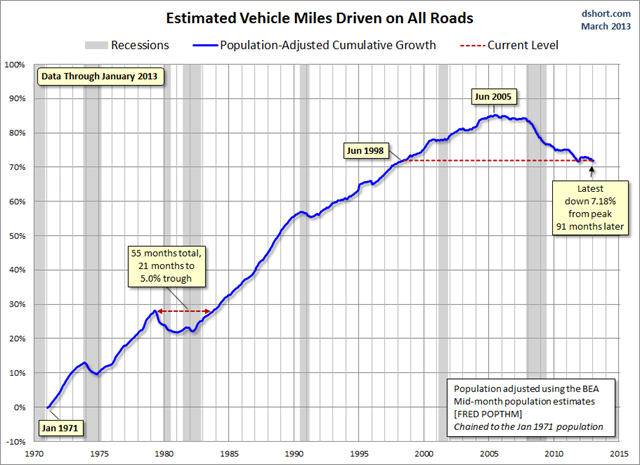
22 March 2013 (Advisor Perspectives) – The Department of Transportation’s Federal Highway Commission has released the latest report on Traffic Volume Trends, data through January. Travel on all roads and streets changed by 0.5% (1.2 billion vehicle miles) for January 2013 as compared with January 2012. The 12-month moving average of miles driven increased only 0.24% from January a year ago (PDF report). And the civilian population-adjusted data (age 16-and-over) has set yet another post-financial crisis low. Here is a chart that illustrates this data series from its inception in 1970. I’m plotting the “Moving 12-Month Total on ALL Roads,” as the DOT terms it. See Figure 1 in the PDF report, which charts the data from 1987. My start date is 1971 because I’m incorporating all the available data from the DOT spreadsheets. The rolling 12-month miles driven contracted from its all-time high for 39 months during the stagflation of the late 1970s to early 1980s, a double-dip recession era. The most recent decline has lasted for 62 months and counting — a new record, but the trough to date was in November 2011, 48 months from the all-time high. […] Here is the same population-adjusted chart … with the total population for the adjustment. In the total-population adjusted version the latest data point of -7.18% is not far off the post-recession low of -7.30% in late 2011. [more]
Vehicle Miles Driven: Population-Adjusted Hits Yet Another Post-Crisis Low