European satellite confirms UW analysis: Arctic Ocean has lost more than a third of summer sea-ice volume since a decade ago
By Hannah Hickey
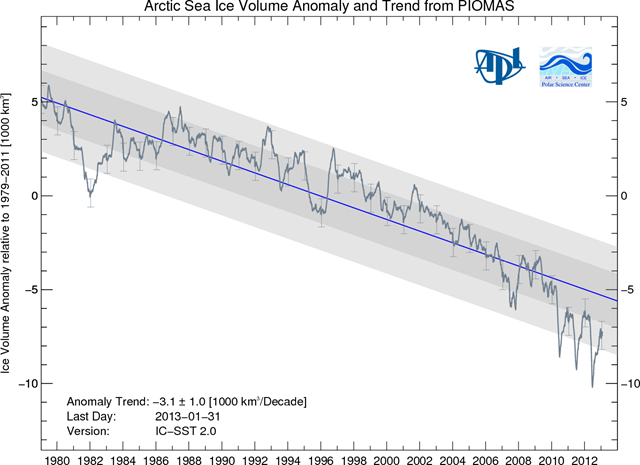
13 February 2013 (University of Washington) – The September 2012 record low in Arctic sea-ice extent was big news, but a missing piece of the puzzle was lurking below the ocean’s surface. What volume of ice floats on Arctic waters? And how does that compare to previous summers? These are difficult but important questions, because how much ice actually remains suggests how vulnerable the ice pack will be to more warming. New satellite observations confirm a University of Washington analysis that for the past three years has produced widely quoted estimates of Arctic sea-ice volume. Findings based on observations from a European Space Agency satellite, published online in Geophysical Research Letters, show that the Arctic has lost more than a third of summer sea-ice volume since a decade ago, when a U.S. satellite collected similar data. Combining the UW model and the new satellite observations suggests the summer minimum in Arctic sea ice is one-fifth of what it was in 1980, when the model begins. “Other people had argued that 75 to 80 percent ice volume loss was too aggressive,” said co-author Axel Schweiger, a polar scientist in the UW Applied Physics Laboratory. “What this new paper shows is that our ice loss estimates may have been too conservative, and that the recent decline is possibly more rapid.” The system developed at the UW provides a 34-year monthly picture of what’s happening to the total volume of Arctic sea ice. The Pan-Arctic Ice Ocean Modeling and Assimilation System, or PIOMAS, combines weather records, sea-surface temperature and satellite pictures of ice coverage to compute ice volume. It then verifies the results with actual thickness measurements from individual moorings or submarines that cruise below the ice. “Because the ice is so variable, you don’t get a full picture of it from any of those observations,” Schweiger said. “So this model is the only way to reconstruct a time series that spans multiple decades.” The UW system also checks its results against five years of precise ice thickness measurements collected by a specialized satellite launched by NASA in 2003. The Ice, Cloud, and Land Elevation Satellite, or ICESat, measured ice thickness across the Arctic to within 37 centimeters (15 inches) until spring of 2008. The U.K.’s CryoSat-2 satellite resumed complete ice thickness measurements in 2010; this is the first scientific paper to share its findings about the recent years of record-low sea ice. Between 2008 and now, the widely cited UW figures have generated some controversy because of the substantial ice loss they showed. “The reanalysis relies on a model, so some people have, justifiably, questioned it,” Schweiger said. “These data essentially confirm that in the last few years, for which we haven’t really had data, the observations are very close to what we see in the model. So that increases our confidence for the overall time series from 1979 to the present.” [more]
European satellite confirms UW numbers: Arctic Ocean is on thin ice