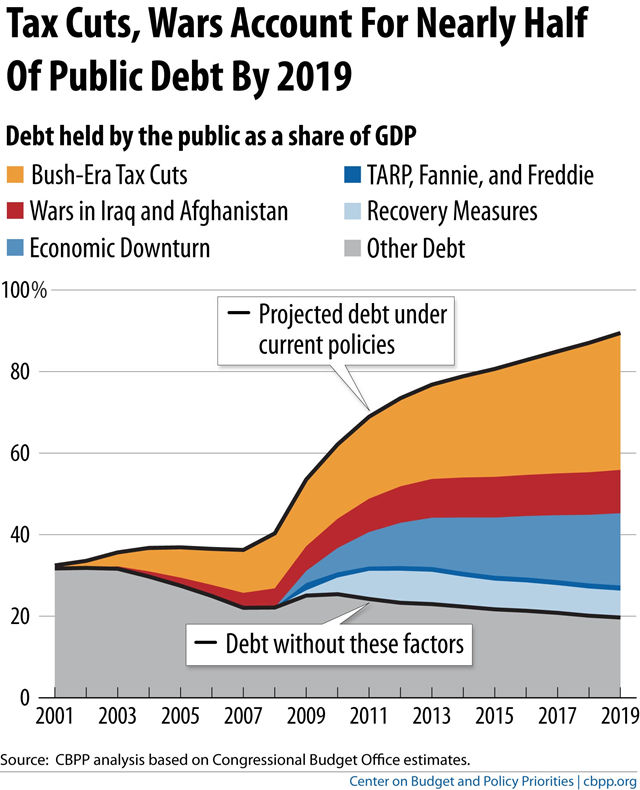
Tax cuts, wars account for nearly half of U.S. public debt by 2019
By Ezra Klein
28 August 2012 You can see it kind of looks like a layer cake. In fact, the folks at the Center on Budget and Policy Priorities call it “the parfait graph.” The top layer, the orange one, that’s the Bush tax cuts. There is no single policy we have passed that has added as much to the debt, or that is projected to add as much to the debt in the future, as the Bush tax cuts, which Republicans passed in 2001 and 2003 and Obama and the Republicans extended in 2010. To my knowledge, all elected Republicans want to make the Bush tax cuts permanent. Democrats, by and large, want to end them for income over $250,000. In second place is the economic crisis. That’s the medium blue. Recessions drive tax revenue down because people lose their jobs, and when you lose your job, you lose your income, and when you lose your income, you can’t pay taxes. Tax revenues in recent years have been 15.4 percent of GDP — the lowest level since the 1950s. Meanwhile, they drive social spending up, because programs like unemployment insurance and Medicaid automatically begin spending more to help the people who have been laid off. Then comes the wars in Iraq and Afghanistan. That’s the red. And then recovery measures like the stimulus. That’s the light blue, and the part for which you can really blame Obama and the Democrats– though it’s worth remembering that the stimulus had to happen because of a recession that began before Obama entered office, and that the Senate Republicans proposed and voted for a $3 trillion tax cut stimulus that would have added almost four times what Obama’s stimulus added to the debt. Then there’s the financial rescue measures like TARP, which is the dark blue line. That’s almost nothing, as much of that money has been paid back. […]
Republican National Convention: The one graph you need to see before watching
