Arctic sea ice extent breaks all-time record low
By Neven
25 August 2012 The daily sea ice extent graph of the National Snow & Ice Data Center in Boulder, Colorado, one of the foremost and best-known organizations observing the Arctic, is showing a new record. […] Another big domino has fallen. All the records on daily extent and area graphs have been broken now, except for IMS, right in time before my holiday (starting tomorrow). Thank you, Al Gore, for destroying the ice so I can go! We now await how low all the daily graphs will go, we await the PIOMAS update in the first week of September, and then the final mega-domino: NSIDC September average minimum (which possibly could remain standing if the daily numbers stall and the melting season ends really early). As an interlude I have a piece coming up about consequences, which will be posted tomorrow. New ASI update will be up later today. Enjoy while it lasts!
Record dominoes 8: NSIDC daily sea ice extent
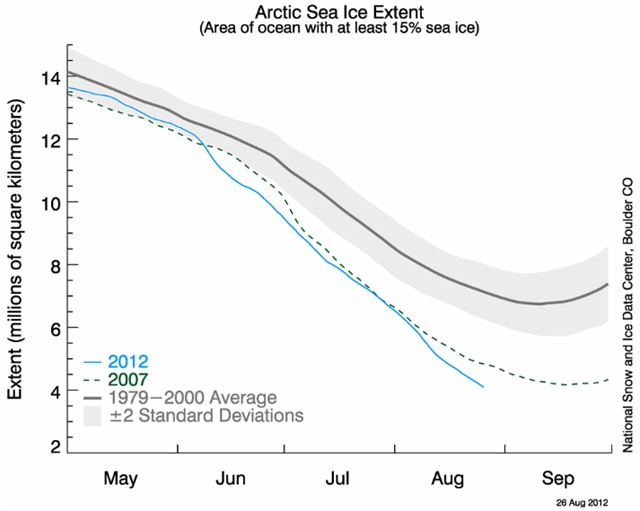
By Natasha Vizcarra
27 August 2012 Arctic sea ice appears to have broken the 2007 record daily extent and is now the lowest in the satellite era. With two to three more weeks left in the melt season, sea ice continues to track below 2007 daily extents. Please note that this is not an announcement of the sea ice minimum extent for 2012. NSIDC will release numbers for the 2012 daily minimum extent when it occurs. A full analysis of the melt season will be published in early October, once monthly data are available for September. Overview of conditions Arctic sea ice extent fell to 4.10 million square kilometers (1.58 million square miles) on August 26, 2012. This was 70,000 square kilometers (27,000 square miles) below the September 18, 2007 daily extent of 4.17 million square kilometers (1.61 million square miles). Including this year, the six lowest ice extents in the satellite record have occurred in the last six years (2007 to 2012). Conditions in context After tracking near 2007 levels through July, the extent declined rapidly in early August. Since then, the loss rate has slowed some, averaging about 75,000 square kilometers (29,000 square miles) per day—equivalent to the size of the state of South Carolina. However, this is still much faster than the normal rate at this time of year of about 40,000 square kilometers per day (15,000 square miles).