Graph of the Day: Annual Global Temperature Means from NASA, NCDC, and Hadley Centre, 1880-2010
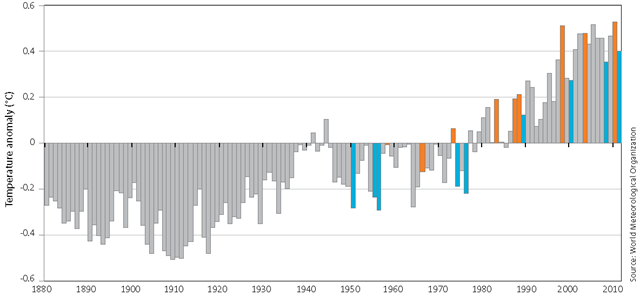
NASA, the US National Climatic Data Centre, and the UK Hadley Centre have each produced global temperature datasets. The graph shows the annual means calculated from the three datasets. Years beginning with an El Niño (orange) and La Niña (blue) are shown after suitable data became available in 1950 (note: 2010 began with an El Niño, and a La Niña then started mid-year). Warming in Australia is consistent with warming observed across the globe during recent decades. Global-average surface temperatures were the warmest on record in 2010 (slightly higher than 2005 and 1998). 2011 was the world’s 11th warmest year, and the warmest year on record during a La Niña event. The world’s 13 warmest years have all occurred in the 15 years since 1997. The planet’s average surface temperature has increased by about 0.8 °C, and Australia’s by about 0.9 ˚C, during the past century. It is very likely (at least 90 per cent likelihood) that most of the observed global warming since the mid-20th century is due to increases in greenhouse gases from human activities. Human activities also have influenced ocean warming, sea-level rise, and temperature extremes. It is very unlikely (less than ten per cent likelihood) that 20th century warming can be explained by natural variability alone. Extreme events are relatively rare and identifying changes in intensity or frequency is more difficult than for changes in averages. There is evidence of changes in some aspects of extreme weather patterns, including fewer cold days and nights and more hot days, hot nights and heatwaves globally in the past 50 years. It is likely that warming of extreme daily minimum and maximum temperatures on the global scale has been influenced by human activities. Weather associated with high fire danger has shown a rapid increase in the late 1990s to early 2000s at many locations in southeastern Australia. Heavy rainfall events have increased in frequency over some areas of the globe, with medium confidence that human influences have contributed to this. Long-term global climate trends are occurring alongside natural weather variations. For example, recent Australian heavy rainfall and flooding can be explained largely by strong La Niñas. However, sea-surface temperatures off the western Australian coast have also been at or near record high values as part of a significant warming of the oceans in the past 50 years. No significant trends in the total numbers of tropical cyclones or in the occurrence of the most intense tropical cyclones have been found in the Australian region.