Graph of the Day: Yale Environmental Performance Index for 132 Countries, 2000-2010
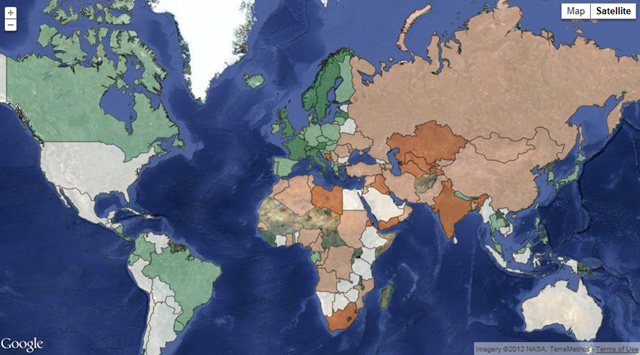
The 2012 Environmental Performance Index (EPI) and Pilot Trend EPI (Trend EPI) rank 132 countries on 22 performance indicators in ten policy categories and two overarching objectives that reflect facets of Environmental Health and Ecosystem Vitality. These indicators provide a gauge of how close countries are to environmental policy goals. The EPI’s proximity-to-target methodology facilitates cross-country comparisons as well as analysis of how the global community is doing collectively on each particular policy issue. The pilot trend EPI reflects changes in environmental performance over the period 2000-2010. The map displays country performance on both the overall EPI and Trend EPI. EPI Methodology: Indicators The 2012 EPI and Pilot Trend EPI build on a historical time series that for the first time allows countries to track environmental performance over the past decade. To consider an indicator for inclusion, we required in almost all cases (except Change in Water Quantity and Forest Loss) the existence of time series data spanning the last decade. The result is that the Indicator Framework for the 2012 EPI and Trend EPI represent a set of core indicators that meet higher standards, including more direct measurements where possible, consistent time series, and institutional commitments to maintain these datasets into the foreseeable future. Each policy category is made up of one or more environmental indicators; some indicators represent direct measures of issue areas, while others are proxy measures that offer a rougher gauge of policy progress by tracking a correlated variable. For each country and indicator, a proximity-to-target value is calculated based on the gap between a country¹s current results and the policy target. See chart below for the complete 2012 EPI policy objective and indicator structure. The indicators are then aggregated into policy categories, which are assigned weights that then determine scores for the Environmental Health and Ecosystem Vitality objectives. Finally, the objective scores are weighted and combined to determine the overall EPI score. The weightings at all levels of aggregation take into consideration the underlying variability in the data, the quality of the datasets, and current policy priorities to produce a balanced EPI score.For details on the Indicator Framework, Data Selection, Indicator Construction, Aggregation and Weighting, and Trend EPI methodology download the full report.
The 2012 Environmental Performance Index (EPI) and Pilot Trend EPI